
West Long Branch, NJ – A majority of Americans say individual states should be able to determine who can carry concealed weapons – an opinion that is at odds with a recent ruling by the U.S. Supreme Court. The Monmouth (“Mon-muth”) University Poll finds that public support for certain gun safety measures – such as comprehensive background checks, red flag laws and a national gun registry – remains high. Few Americans have heard a lot about the new federal gun safety law enacted last week, but most agree with gun advocates that the nation’s mental health crisis is a bigger contributor to mass shootings than the ease of obtaining firearms.
The American public differs from the U.S. Supreme Court when it comes to the nation’s approach to gun laws. Specifically, 56% of Americans say that individual states should be allowed to limit who can carry a concealed handgun by requiring permit applicants to demonstrate that they need the weapon for their work or for protection. Another 42% side with the court’s recent decision and say states should not be able to do this. In six states impacted by the high court’s ruling abolishing “may issue” permit laws – California, Hawaii, Maryland, Massachusetts, New Jersey, and New York – only 26% of residents endorse the court’s position. In these six states, 42% of residents say the high court’s recent ruling against these permit laws will make the public less safe where they live, while 19% say the public will be more safe and 39% say the ruling will have no impact on public safety where they live.
“Both the Supreme Court and the American public are bitterly divided on the question of gun access. The big difference, though, is a majority of the public comes down on the opposite side of the issue from a majority of the court,” said Patrick Murray, director of the independent Monmouth University Polling Institute.
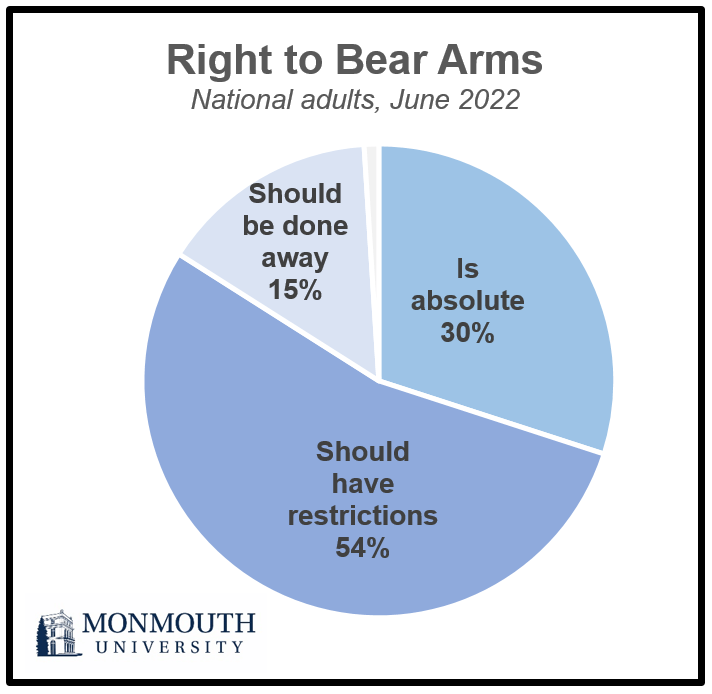
Just 30% of Americans see the Second Amendment as offering an absolute right to bear arms. More than half (54%) say the right is important but should have restrictions, while 15% say it would be better for the country to do away with the right to bear arms entirely. Among current gun owners, 49% view the Second Amendment as an absolute right while 47% say the right to bear arms should have some restrictions.
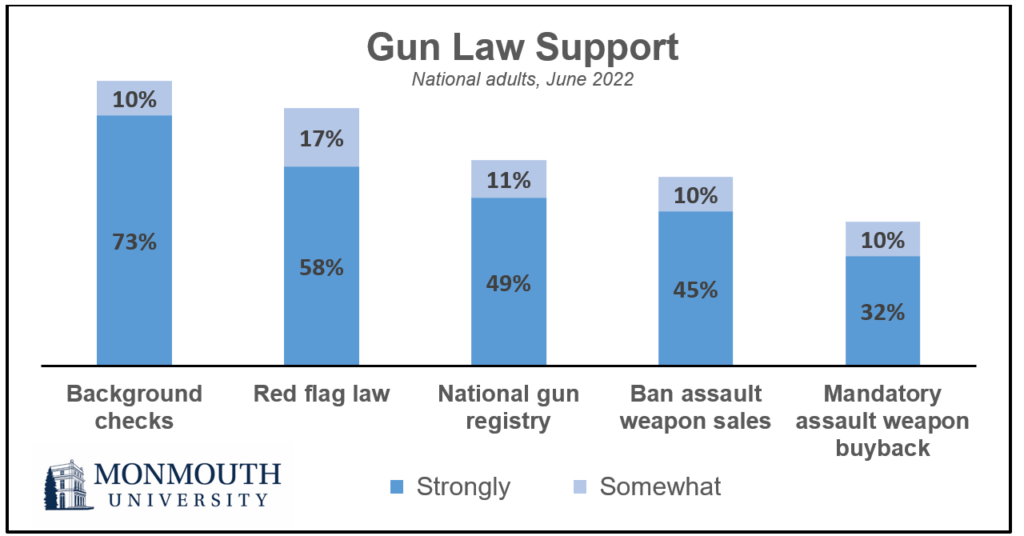
An overwhelming majority of the public (83%) supports a comprehensive background check requirement for all gun purchasers. This includes 76% of current gun owners. Three in four Americans (75%) – including 60% of gun owners – support a federal red flag law that would allow police to temporarily take away the guns of someone who poses a threat to themselves or others. Majorities also support establishing a national gun ownership database (60%) and a ban on the future sale of assault weapons (55%) – although current gun owners are less supportive (41% back having a national database and 33% support banning future assault weapon sales). Less than half of the American public (42%) – and 18% of gun owners – back banning and a mandatory buyback of currently owned assault weapons. The vast majority of people who back these measures say they strongly support them. Support levels for the gun measures are virtually unchanged from a Monmouth poll taken in 2019.
The federal bipartisan gun safety bill enacted on the heels of the Supreme Court decision was touted as the most significant gun reform legislation in a generation. However, a third of the public has not heard anything about it. Among the rest, more approve (36%) than disapprove (19%) of the legislation. A third of the public (32%) says the gun safety measures in the new law do not go far enough. Just 9% say they do go far enough and 15% say they go too far. Over 4 in 10 (44%), though, have not heard about the bill or have no opinion of it.
When asked which factor is more responsible for the number of recent mass shootings in the U.S., 55% say it is a mental health crisis in the country while 33% say the ease of getting guns is more to blame. Just over half of the public (53%) expects the frequency of mass shootings in the country will increase in the next five years. Just 9% say the frequency will decrease and 35% say the mass shooting rate will remain about the same.
There are huge partisan differences on these questions. The vast majority of Republicans (80%) point to mental health issues as the problem while most Democrats (62%) say gun access is the prime culprit. Moreover, 64% of Democrats expect gun violence to increase in the next five years. Fewer Republicans (39%) feel the same, although it is interesting that only 15% of Republicans actually expect it to decrease.
“Other countries with similar public mental health challenges experience far less gun violence than the U.S. These results may indicate that gun advocates’ messaging about mental health being at the root of these mass shootings has been fairly effective with the American public. This new gun safety law, and its focus on mental health remedies, reinforces that message,” said Murray.
The number of self-reported gun owners, as well as the reasons they give for having a weapon, have remained steady over the past four years. Currently, 35% of American adults say they own a gun, pistol, or rifle – including 49% of men and 21% of women. The top reasons for owning a gun are personal safety (71% major reason) and to protect property (62%). Just under half say a major reason for having a gun is to go hunting (47%) or target shooting (43%). These top reasons are largely in line with responses current and former gun owners gave in a 2018 Monmouth poll. Purposes that are less likely to be cited as major reasons for owning a gun include to collect as a hobby (32%), to defend against possible government tyranny (28%) or as a job requirement (17%) – although each of these results is 5 to 6 points higher than in 2018.
The Monmouth University Poll was conducted by telephone from June 23 to 27, 2022 with 978 adults in the United States. The question results in this release have a margin of error of +/- 3.1 percentage points. The poll was conducted by the Monmouth University Polling Institute in West Long Branch, NJ.
QUESTIONS AND RESULTS
(* Some columns may not add to 100% due to rounding.)
[Q1-4 & 6-21 held for future release.]
[Q5 & 22-28 previously released.]
29.Which of the following statements comes closest to your view of the Second Amendment of the Constitution?
| June 2022 | |
| The right to bear arms is an absolute right and should not be limited | 30% |
| The right to bear arms is important, but should have restrictions | 54% |
| It would be better for the country if we did away with the right to bear arms entirely | 15% |
| (VOL) Don’t know | 1% |
| (n) | (978) |
30.Do you support or oppose requiring comprehensive background checks for all gun purchasers, including private sales between two individuals? [Do you support/oppose that strongly or somewhat?]
| TREND: | June 2022 | Aug. 2019 | March 2018 |
| Strongly support | 73% | 68% | 68% |
| Somewhat support | 10% | 15% | 15% |
| Somewhat oppose | 6% | 4% | 5% |
| Strongly oppose | 11% | 9% | 11% |
| (VOL) Don’t know | 1% | 3% | 2% |
| (n) | (978) | (800) | (803) |
31.Do you support or oppose establishing a national gun ownership database to register all guns in the country? [Do you support/oppose that strongly or somewhat?]
| TREND: | June 2022 | Aug. 2019 | March 2018 |
| Strongly support | 49% | 49% | 52% |
| Somewhat support | 11% | 13% | 13% |
| Somewhat oppose | 7% | 8% | 7% |
| Strongly oppose | 31% | 25% | 25% |
| (VOL) Don’t know | 2% | 5% | 3% |
| (n) | (978) | (800) | (803) |
32.Do you support or oppose banning the future sale of assault weapons? [Do you support/oppose that strongly or somewhat?]
| TREND: | June 2022 | Aug. 2019 |
| Strongly support | 45% | 44% |
| Somewhat support | 10% | 12% |
| Somewhat oppose | 10% | 10% |
| Strongly oppose | 32% | 28% |
| (VOL) Don’t know | 3% | 6% |
| (n) | (978) | (800) |
33.Do you support or oppose banning the ownership of assault weapons so that current owners have to turn in their guns to a mandatory buyback program? [Do you support/oppose that strongly or somewhat?]
| TREND: | June 2022 | Aug. 2019 |
| Strongly support | 32% | 33% |
| Somewhat support | 10% | 10% |
| Somewhat oppose | 11% | 13% |
| Strongly oppose | 45% | 40% |
| (VOL) Don’t know | 2% | 4% |
| (n) | (978) | (800) |
34.Do you support or oppose a federal red flag law that would allow police to temporarily take away the guns of someone who poses a threat to themselves or others? [Do you support/oppose that strongly or somewhat?]
| TREND: | June 2022 | Aug. 2019 |
| Strongly support | 58% | 53% |
| Somewhat support | 17% | 22% |
| Somewhat oppose | 6% | 7% |
| Strongly oppose | 18% | 13% |
| (VOL) Don’t know | 1% | 4% |
| (n) | (978) | (800) |
35.Do you agree or disagree that individual states should be allowed to limit who can carry a concealed handgun by requiring permit applicants to demonstrate that they need the weapon for their work or for protection?
| June 2022 | |
| Agree | 56% |
| Disagree | 42% |
| (VOL) Don’t know | 3% |
| (n) | (978) |
35A.On Thursday, the Supreme Court ruled that states cannot impose limitations on who is allowed to carry a concealed handgun in public. Based on current gun measures in your state, do you think this ruling will make the public more safe, less safe, or will it have no impact on public safety where you live?
| June 2022 | |
| More safe | 22% |
| Less safe | 34% |
| No impact | 41% |
| (VOL) Don’t know | 3% |
| (n) | (978) |
36.Do you think the number of recent mass shootings in the U.S. is due more to the ease of getting guns or due more to a mental health crisis in the country?
| June 2022 | |
| Ease of getting guns | 33% |
| Mental health crisis | 55% |
| (VOL) Both equally | 9% |
| (VOL) Don’t know | 3% |
| (n) | (978) |
37.Over the next five years, do you expect that the frequency of mass shootings in the country will increase, decrease, or stay about the same?
| June 2022 | |
| Increase | 53% |
| Decrease | 9% |
| Stay about the same | 35% |
| (VOL) Don’t know | 3% |
| (n) | (978) |
38.Congress just passed a new bipartisan gun safety bill. How much have you heard about this bill – a lot, a little, or nothing at all?
| June 2022 | |
| A lot | 22% |
| A little | 42% |
| Nothing at all | 35% |
| (n) | (978) |
38A.Do you approve or disapprove of the bipartisan gun safety bill?
| June 2022 | |
| Approve | 36% |
| Disapprove | 19% |
| (VOL) Don’t know | 10% |
| Not heard about (from Q38) | 35% |
| (n) | (978) |
38B.Do you think the gun safety measures in the bill go far enough, do not go far enough, or go too far?
| June 2022 | |
| Go far enough | 9% |
| Do not go far enough | 32% |
| Go too far | 15% |
| (VOL) Don’t know | 9% |
| Not heard about (from Q38) | 35% |
| (n) | (978) |
39.Do you or anyone in your household own a gun, rifle, or pistol? [If YES: Is that you or someone else in your household?]
| TREND: | June 2022 | Aug. 2019 | March 2018 |
| Yes, self | 20% | 19% | 17% |
| Yes, someone else | 13% | 10% | 12% |
| Yes, both self and someone else | 15% | 15% | 17% |
| No, nobody in household owns a gun | 44% | 51% | 47% |
| (VOL) Don’t know | 8% | 5% | 7% |
| (n) | (978) | (800) | (803) |
[The following question was asked of current and former gun owners; n=467; moe = +/- 4.5%]
40.There are many reasons why people own guns. For each one I read, please tell me if this is a major reason, minor reason, or not a reason why you own [owned] a gun. [ITEMS WERE ROTATED]
For personal safety to protect against an attacker
| TREND: | June 2022 | March 2018 |
| Major reason | 71% | 68% |
| Minor reason | 14% | 18% |
| Not a reason | 14% | 13% |
| (VOL) Don’t know | 0% | 0% |
| (n) | (467) | (376) |
To protect my property
| TREND: | June 2022 | March 2018 |
| Major reason | 62% | 61% |
| Minor reason | 22% | 23% |
| Not a reason | 16% | 16% |
| (VOL) Don’t know | 0% | 0% |
| (n) | (467) | (376) |
For hunting
| TREND: | June 2022 | March 2018 |
| Major reason | 47% | 48% |
| Minor reason | 21% | 19% |
| Not a reason | 32% | 33% |
| (VOL) Don’t know | 0% | 1% |
| (n) | (467) | (376) |
For target shooting
| TREND: | June 2022 | March 2018 |
| Major reason | 43% | 47% |
| Minor reason | 32% | 24% |
| Not a reason | 24% | 29% |
| (VOL) Don’t know | 1% | 0% |
| (n) | (467) | (376) |
Need it for my job or work
| TREND: | June 2022 | March 2018 |
| Major reason | 17% | 11% |
| Minor reason | 10% | 12% |
| Not a reason | 72% | 76% |
| (VOL) Don’t know | 1% | 1% |
| (n) | (467) | (376) |
To defend against possible government tyranny
| TREND: | June 2022 | March 2018 |
| Major reason | 28% | 23% |
| Minor reason | 23% | 23% |
| Not a reason | 48% | 51% |
| (VOL) Don’t know | 1% | 2% |
| (n) | (467) | (376) |
To collect as a hobby
| TREND: | June 2022 | March 2018 |
| Major reason | 32% | 27% |
| Minor reason | 28% | 30% |
| Not a reason | 40% | 43% |
| (VOL) Don’t know | 0% | 0% |
| (n) | (467) | (376) |
METHODOLOGY
The Monmouth University Poll was sponsored and conducted by the Monmouth University Polling Institute from June 23 to 27, 2022 with a probability-based national random sample of 978 adults age 18 and older. This includes 343 contacted by a live interviewer on a landline telephone and 635 contacted by a live interviewer on a cell phone, in English. Telephone numbers were selected through a mix of random digit dialing and list-based sampling. Landline respondents were selected with a modified Troldahl-Carter youngest adult household screen. Interviewing services were provided by Braun Research, with sample obtained from Dynata (RDD, n=565), Aristotle (list, n=168) and a panel of prior Monmouth poll participants (n=245). Monmouth is responsible for all aspects of the survey design, data weighting and analysis. The full sample is weighted for region, age, education, gender and race based on US Census information (ACS 2018 one-year survey). For results based on this sample, one can say with 95% confidence that the error attributable to sampling has a maximum margin of plus or minus 3.1 percentage points (unadjusted for sample design). Sampling error can be larger for sub-groups (see table below). In addition to sampling error, one should bear in mind that question wording and practical difficulties in conducting surveys can introduce error or bias into the findings of opinion polls.
DEMOGRAPHICS (weighted) |
| Self-Reported |
| 26% Republican |
| 43% Independent |
| 31% Democrat |
| 49% Male |
| 51% Female |
| 30% 18-34 |
| 33% 35-54 |
| 37% 55+ |
| 63% White |
| 12% Black |
| 16% Hispanic |
| 9% Asian/Other |
| 69% No degree |
| 31% 4 year degree |
Click on pdf file link below for full methodology and crosstabs by key demographic groups.


