West Long Branch, NJ – Public opinion on an assault weapons ban has shifted from majority backing to a split decision. Support for background checks remains high, though not quite as strong as it was last year. The Monmouth (“Mon-muth”) University Poll also finds that half of the country believes the frequency of mass shootings will increase over the next five years.
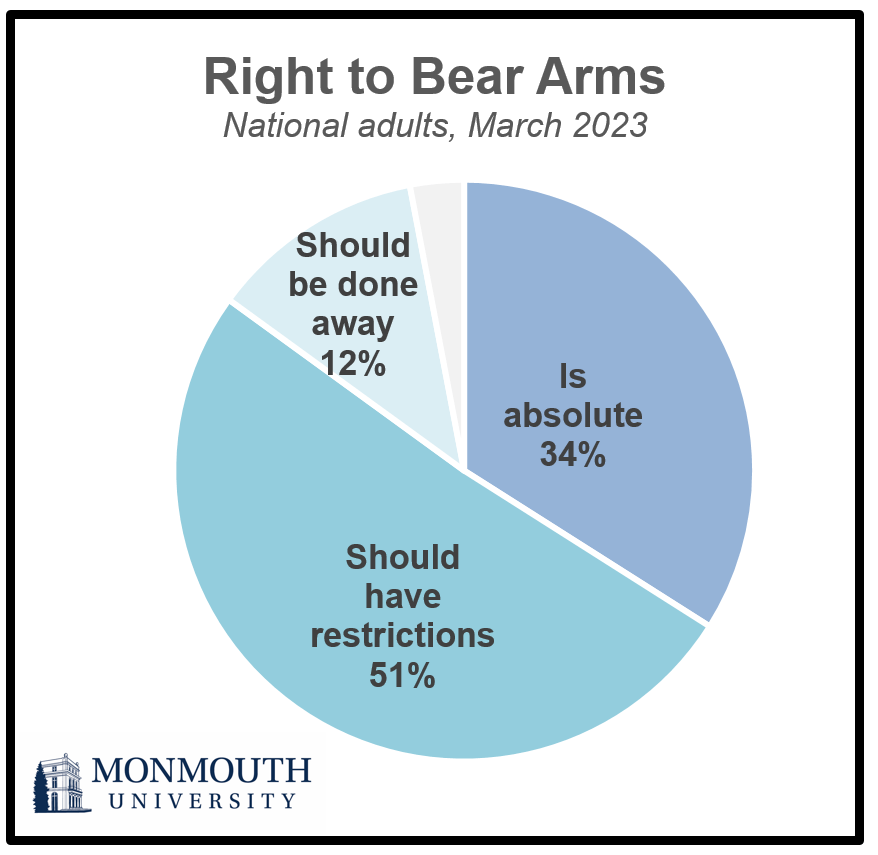
One in three Americans (34%) – including 59% of Republicans – say the Second Amendment right to bear arms is absolute and should not be limited. Just over half of the public (51%) – including 66% of Democrats – believes the right to bear arms is important but should have restrictions. Another 12% feel it would be better for the country if we did away with the right to bear arms entirely. These results are similar to a Monmouth poll taken in June 2022.
The public is currently divided over a ban on the future sale of assault weapons – 46% support this and 49% are opposed. Last year, a majority (55%) favored such a ban while 42% stood in opposition. The drop in support has come mainly from independents (49% in 2022 to 37% now), but there have also been declines among Republicans (from 32% to 24%) and Democrats (from 82% to 77%).
“Despite continued incidents of mass shootings, public support for banning assault weapons has dipped. It’s not clear why, since support for some other gun measures remains widespread,” said Patrick Murray, director of the independent Monmouth University Polling Institute.
About 8 in 10 Americans (81%) support requiring comprehensive background checks for all gun purchasers, which is similar to overall support levels last year. However, the number who strongly support background checks has declined from 73% in June 2022 to 64%. Moreover, just 28% of the public feels the president should be able to order background checks by executive order, something President Joe Biden did in a limited approach last month. A majority (64%) say such a measure should only be instituted by an act of Congress.
“Support for background checks remains high, but not for the way President Biden tried to go about,” said Murray.
The poll also finds that more than 7 in 10 Americans (72%) support a federal red flag law that would allow police to temporarily take away the guns of someone who poses a threat to themselves or others. This is similar to the 75% support level recorded last year, although strong support for red flag laws has dipped from 58% to 49%.
A majority of the public (56%) feels that individual states should be allowed to limit who can carry a concealed handgun by requiring permit applicants to demonstrate that they need the weapon for their work or for protection. Another 41% disagree, effectively siding with a U.S. Supreme Court decision last summer that curtailed states’ ability to make gun laws. These findings are nearly identical to a June 2022 Monmouth poll which was taken shortly after the court’s ruling.
About half of the public (49%) expects the frequency of mass shootings in the country to increase over the next five years. Just 8% believe the frequency will decrease and 39% feel it will stay about the same. Those who expect to see a rise in mass shootings include 69% of Democrats, 43% of independents, and 37% of Republicans. These results are similar to a year ago. [Note: the poll was conducted before the recent Nashville shooting but after shootings in Michigan and California earlier this year and numerous other shootings last year that occurred subsequent to Monmouth’s prior poll in June 2022.]
The Monmouth University Poll was conducted by telephone from March 16 to 20, 2023 with 805 adults in the United States. The question results in this release have a margin of error of +/- 5.8 percentage points for the full sample. The poll was conducted by the Monmouth University Polling Institute in West Long Branch, NJ.
QUESTIONS AND RESULTS
(* Some columns may not add to 100% due to rounding.)
[Q1-10 previously released.]
11.Which of the following statements comes closest to your view of the Second Amendment of the Constitution?
| Trend: | March 2023 | June 2022 |
|---|---|---|
| The right to bear arms is an absolute right and should not be limited | 34% | 30% |
| The right to bear arms is important, but should have restrictions | 51% | 54% |
| It would be better for the country if we did away with the right to bear arms entirely | 12% | 15% |
| (VOL) Don’t know | 3% | 1% |
| (n) | (805) | (978) |
12.Do you support or oppose requiring comprehensive background checks for all gun purchasers, including private sales between two individuals? [Do you support/oppose that strongly or somewhat?]
| Trend: | March 2023 | June 2022 | Aug. 2019 | March 2018 |
|---|---|---|---|---|
| Strongly support | 64% | 73% | 68% | 68% |
| Somewhat support | 17% | 10% | 15% | 15% |
| Somewhat oppose | 6% | 6% | 4% | 5% |
| Strongly oppose | 10% | 11% | 9% | 11% |
| (VOL) Don’t know | 3% | 1% | 3% | 2% |
| (n) | (805) | (978) | (800) | (803) |
13.Do you think the president should be able to order background checks for gun purchases by executive order or should this only be done by an act of Congress?
| Response: | March 2023 |
|---|---|
| Be able by executive order | 28% |
| Only by an act of Congress | 64% |
| (VOL) Don’t know | 8% |
| (n) | (805) |
14.Do you support or oppose banning the future sale of assault weapons? [Do you support/oppose that strongly or somewhat?]
| Trend: | March 2023 | June 2022 | Aug. 2019 |
|---|---|---|---|
| Strongly support | 37% | 45% | 44% |
| Somewhat support | 9% | 10% | 12% |
| Somewhat oppose | 16% | 10% | 10% |
| Strongly oppose | 33% | 32% | 28% |
| (VOL) Don’t know | 6% | 3% | 6% |
| (n) | (805) | (978) | (800) |
15.Do you support or oppose a federal red flag law that would allow police to temporarily take away the guns of someone who poses a threat to themselves or others? [Do you support/oppose that strongly or somewhat?]
| Trend: | March 2023 | June 2022 | Aug. 2019 |
|---|---|---|---|
| Strongly support | 49% | 58% | 53% |
| Somewhat support | 23% | 17% | 22% |
| Somewhat oppose | 8% | 6% | 7% |
| Strongly oppose | 16% | 18% | 13% |
| (VOL) Don’t know | 4% | 1% | 4% |
| (n) | (805) | (978) | (800) |
16.Do you agree or disagree that individual states should be allowed to limit who can carry a concealed handgun by requiring permit applicants to demonstrate that they need the weapon for their work or for protection?
| Trend: | March 2023 | June 2022 |
|---|---|---|
| Agree | 56% | 56% |
| Disagree | 41% | 42% |
| (VOL) Don’t know | 3% | 3% |
| (n) | (805) | (978) |
17.Over the next five years, do you expect that the frequency of mass shootings in the country will increase, decrease, or stay about the same?
| Trend: | March 2023 | June 2022 |
|---|---|---|
| Increase | 49% | 53% |
| Decrease | 8% | 9% |
| Stay about the same | 39% | 35% |
| (VOL) Don’t know | 4% | 3% |
| (n) | (805) | (978) |
[Q18-27 previously released.]
Methodology
The Monmouth University Poll was sponsored and conducted by the Monmouth University Polling Institute from March 16 to 20, 2023 with a probability-based national random sample of 805 adults age 18 and older. This includes 284 contacted by a live interviewer on a landline telephone and 521 contacted by a live interviewer on a cell phone, in English. Telephone numbers were selected through a mix of random digit dialing and list-based sampling. Landline respondents were selected with a modified Troldahl-Carter youngest adult household screen. Interviewing services were provided by Braun Research, with sample obtained from Dynata (RDD, n= 479), Aristotle (list, n= 133) and a panel of prior Monmouth poll participants (n= 193). Monmouth is responsible for all aspects of the survey design, data weighting and analysis. The full sample is weighted for region, age, education, gender and race based on US Census information (ACS 2021 one-year survey). For results based on this sample, one can say with 95% confidence that the error attributable to sampling has a maximum margin of plus or minus 5.8 percentage points adjusted for sample design effects (1.68). Sampling error can be larger for sub-groups (see table below). In addition to sampling error, one should bear in mind that question wording and practical difficulties in conducting surveys can introduce error or bias into the findings of opinion polls.
DEMOGRAPHICS (weighted) |
| Self-Reported |
| 25% Republican |
| 45% Independent |
| 30% Democrat |
| 49% Male |
| 51% Female |
| 29% 18-34 |
| 33% 35-54 |
| 38% 55+ |
| 61% White |
| 12% Black |
| 17% Hispanic |
| 10% Asian/Other |
| 67% No degree |
| 33% 4 year degree |
Click on pdf file link below for full methodology and crosstabs by key demographic groups.


