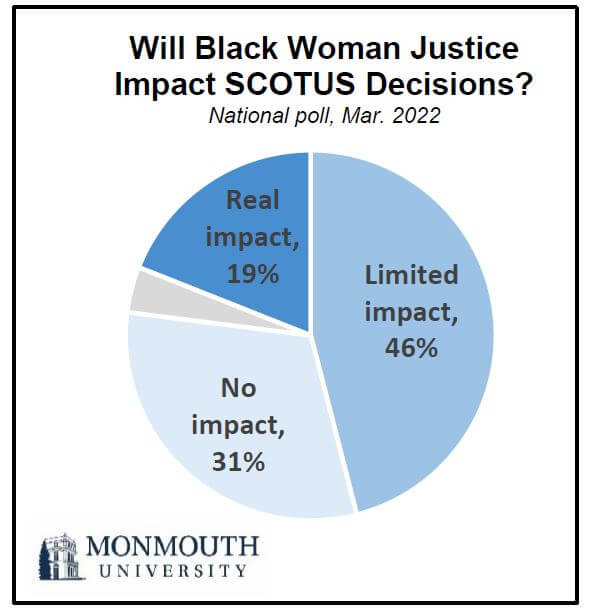
West Long Branch, NJ – Americans back the appointment of Judge Ketanji Brown Jackson to the U.S. Supreme Court by a more than 2 to 1 margin. A majority also approve of President Joe Biden’s promise to name a Black woman as his first SCOTUS nominee. The Monmouth (“Mon-muth”) University Poll finds more than two-thirds of the public feels it is important for the court to reflect the nation’s diversity. About 2 in 10 believe that having a Black woman on the Supreme Court will have a real impact on how cases are decided while 3 in 10 say it will have no impact.
A majority of Americans (55%) say Jackson should be confirmed as an associate justice on the Supreme Court. Only 21% say she should not be confirmed and 24% offer no opinion. Nearly half of the public has heard enough about Jackson to feel that she is either very qualified (33%) or somewhat qualified (14%) for the position. Only 9% say she is not qualified while 43% have not heard enough about the nominee to assess her qualifications.
Other poll findings include:
- More than half of the public (53%) approve of Biden’s promise to name a Black woman as his first SCOTUS nominee, while 41% disapprove of him making this a primary factor in his choice.
- More than 2 in 3 Americans feel that having a court that looks like the racial, ethnic, and gender composition of the country is either very (46%) or somewhat (23%) important.
- 19% feel that having a Black woman on the Supreme Court will have a real impact on how cases are decided, while 46% say it will have a limited impact and 31% say no impact.
“Expectations of Judge Jackson’s impact may be limited, but that might be seen as a good thing. The public may primarily see all nine justices as sharing a common background as jurists first and foremost. The diversity of its membership brings more nuance to their deliberations. Overall, initial reaction to this nomination is broadly positive,” said Patrick Murray, director of the independent Monmouth University Polling Institute.
There is widespread support for Jackson’s nomination among Democrats while Republicans tend to be opposed, but not overwhelmingly so. Specifically, 82% of Democrats say Jackson should be confirmed and 64% say she is very qualified. Among Republicans, 42% say she should not be confirmed (compared with 29% who say she should), but only 20% feel Jackson is not qualified to sit on the court (compared with 34% who say she is qualified).
Among Black Americans, 73% say Jackson should be confirmed (just 3% oppose her confirmation and 24% have no opinion) and 80% approve of Biden’s promise to name a Black woman as his first SCOTUS nominee. By comparison, 61% of other racial minorities approve of Biden making race and gender a priority in his choice, but non-Hispanic whites are divided on this (45% approve and 50% disapprove).
The Monmouth poll also finds the U.S. Supreme Court as a whole receives a split 42% approve and 42% disapprove rating for the job it is doing. Republicans (52%) are more likely than Democrats (31%) to approve. Six years ago, the Supreme Court earned a more positive rating of 49% approve and 33% disapprove, with Democrats (65% approve) being more positive than Republicans (36% approve).
The Monmouth University Poll was conducted by telephone from March 10 to 14, 2022 with 809 adults in the United States. The question results in this release have a margin of error of +/- 3.5 percentage points. The poll was conducted by the Monmouth University Polling Institute in West Long Branch, NJ.
QUESTIONS AND RESULTS
(* Some columns may not add to 100% due to rounding.)
[Q1-12 previously released.]
13.Do you approve or disapprove of the job the U.S. Supreme Court is doing?
| TREND: | March 2022 | Sept. 2021 | March 2016 |
| Approve | 42% | 42% | 49% |
| Disapprove | 42% | 45% | 33% |
| (VOL) Don’t know | 16% | 12% | 17% |
| (n) | (809) | (802) | (1,008) |
14.As you may have heard, President Biden recently nominated Ketanji Brown Jackson to serve as a Justice on the Supreme Court. From what you have heard of her experience, do you think she is very qualified, somewhat qualified, or not qualified to serve on the Supreme Court, or haven’t you heard enough about her experience?
| March 2022 | |
| Very qualified | 33% |
| Somewhat qualified | 14% |
| Not qualified | 9% |
| Haven’t heard enough | 43% |
| (VOL) Refused | 1% |
| (n) | (809) |
15.All in all, do you feel Ketanji Brown Jackson should or should not be confirmed as a Justice on the U.S. Supreme Court?
| March 2022 | |
| Should | 55% |
| Should not | 21% |
| (VOL) Don’t know | 24% |
| (n) | (809) |
16.When he was campaigning for president, Joe Biden said that his first Supreme Court nomination would be a Black woman. Do you approve or disapprove of him making this a primary factor in his choice of nominee?
| March 2022 | |
| Approve | 53% |
| Disapprove | 41% |
| (VOL) Don’t know | 6% |
| (n) | (809) |
17.How important is it for the Supreme Court to look like the racial, ethnic and gender composition of the country as a whole – very important, somewhat important, not too important, or not at all important?
| March 2022 | |
| Very important | 46% |
| Somewhat important | 23% |
| Not too important | 10% |
| Not at all important | 20% |
| (VOL) Don’t know | 1% |
| (n) | (809) |
18.Which of the following three statements do you agree with most: having a Black woman on the Supreme Court will have a real impact on how cases are decided; having a Black woman on the Supreme Court will have only a limited impact on how cases are decided; or having a Black woman on the Supreme Court will not have any impact on how cases are decided?
| March 2022 | |
| Real impact | 19% |
| Limited impact | 46% |
| Not any impact | 31% |
| (VOL) Don’t know | 4% |
| (n) | (809) |
[Q19 held.]
[Q20-29 & Q40 previously released.]
[Q30-39 held for future release.]
METHODOLOGY
The Monmouth University Poll was sponsored and conducted by the Monmouth University Polling Institute from March 10 to 14, 2022 with a probability-based national random sample of 809 adults age 18 and older. This includes 278 contacted by a live interviewer on a landline telephone and 531 contacted by a live interviewer on a cell phone, in English. Telephone numbers were selected through a mix of random digit dialing and list-based sampling. Landline respondents were selected with a modified Troldahl-Carter youngest adult household screen. Interviewing services were provided by Braun Research, with sample obtained from Dynata (RDD, n=545), Aristotle (list, n=140) and a panel of prior Monmouth poll participants (n=124). Monmouth is responsible for all aspects of the survey design, data weighting and analysis. The full sample is weighted for region, age, education, gender and race based on US Census information (ACS 2018 one-year survey). For results based on this sample, one can say with 95% confidence that the error attributable to sampling has a maximum margin of plus or minus 3.5 percentage points (unadjusted for sample design). Sampling error can be larger for sub-groups (see table below). In addition to sampling error, one should bear in mind that question wording and practical difficulties in conducting surveys can introduce error or bias into the findings of opinion polls.
| DEMOGRAPHICS (weighted) |
| Self-Reported |
| 29% Republican |
| 43% Independent |
| 28% Democrat |
| 49% Male |
| 51% Female |
| 30% 18-34 |
| 32% 35-54 |
| 38% 55+ |
| 63% White |
| 13% Black |
| 16% Hispanic |
| 8% Asian/Other |
| 70% No degree |
| 30% 4 year degree |
Click on pdf file link below for full methodology and crosstabs by key demographic groups.


