
West Long Branch, NJ – Josh Shapiro, the Democratic candidate for governor, continues to hold a large edge on key metrics in the race, while most Pennsylvania voters say his Republican opponent Doug Mastriano is out of step with the commonwealth. The Monmouth (“Mon-muth”) University Poll also finds Democrats are more confident than Republicans that the upcoming election will be run fairly.
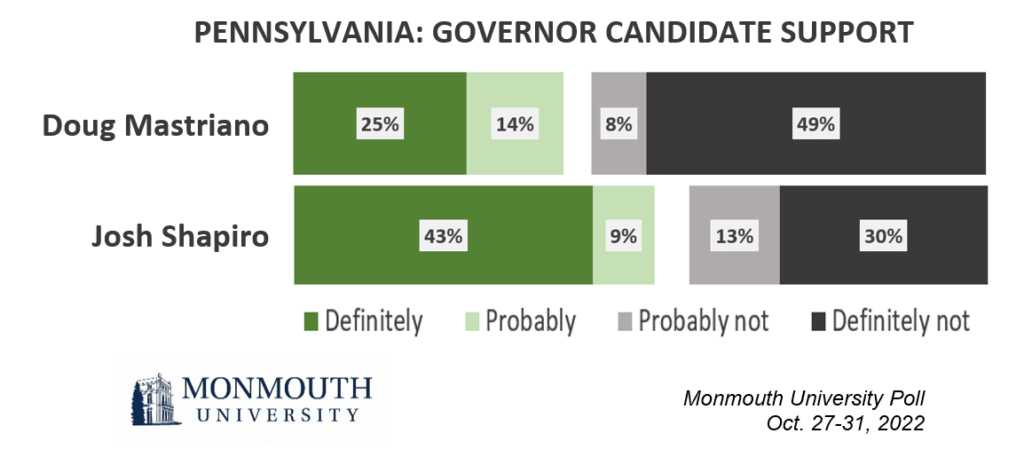
More than half of potential voters say they will either definitely (43%) or probably (9%) vote for Shapiro in November, while just under 4 in 10 will definitely (25%) or probably (14%) vote for Mastriano. Neither candidate’s combined support level – currently 52% for the Democrat and 39% for the Republican – has moved throughout the fall, although Shapiro’s “definite” support has increased by 10 points from September compared to just 4 points for Mastriano. Significantly more Pennsylvania voters say they definitely will not vote for Mastriano (49%) than those who completely rule out Shapiro (30%). Just 3% of Pennsylvania voters say they will definitely choose a third-party option in the race for governor.
Shapiro is backed, or likely to be backed, by 18% of Republican voters, while 7% of self-described Democrats indicate they will vote for Mastriano. Among independent voters, Shapiro has 52% combined support and Mastriano has 33% combined support. Looking at split-ticket potential with the U.S. Senate race, 7% of the electorate is comprised of crossover Shapiro-Mehmet Oz voters, while only 2% support a Mastriano-John Fetterman combination.
“Considering how tight the senate contest is right now, Shapiro is looking exceptionally strong in the race for governor. The bottom line is at least half the electorate finds Mastriano to be an unacceptable choice,” said Patrick Murray, director of the independent Monmouth University Polling Institute.
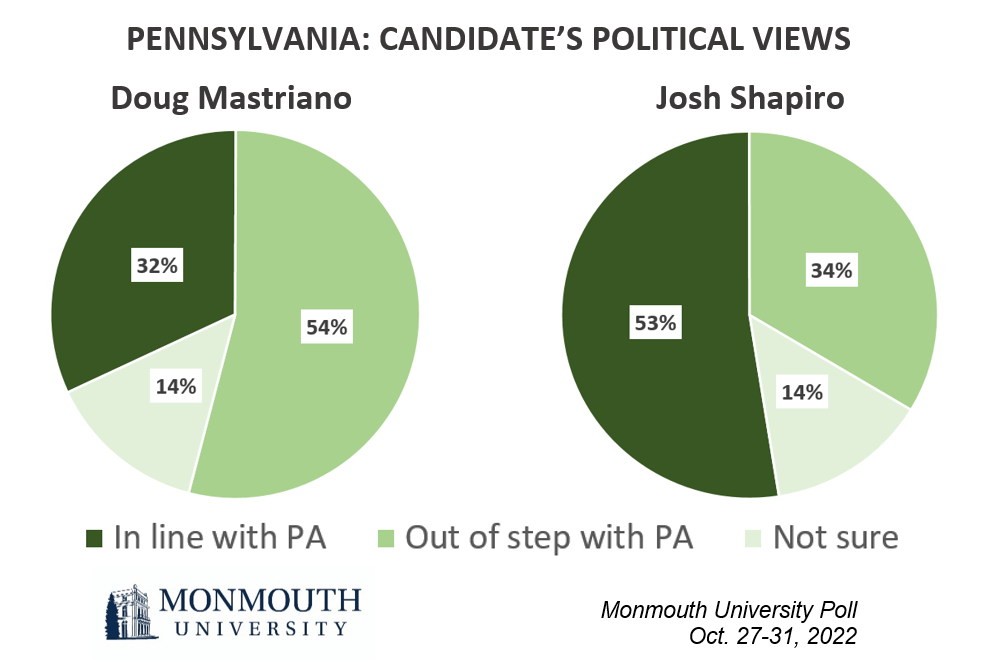
Less than one-third of the electorate (32%) feels Mastriano’s political views are in line with most Pennsylvanians while a majority (54%) say he is out of step with the state. The results for his opponent are a mirror image of these numbers – 53% say Shapiro’s views are in line with Pennsylvania residents and just 34% say he is out of step. Shapiro has a decidedly positive personal rating of 57% favorable to 34% unfavorable, while Mastriano holds a net negative rating of 35% favorable to 52% unfavorable. These results are nearly identical to Monmouth polling results throughout the fall.
The poll asked voters about the importance of seven different issues in deciding who to support for governor. Shapiro maintains an advantage on every one, including the pressing concern of jobs, the economy and cost of living – 46% trust Shapiro more on this issue while 32% trust Mastriano more. Importantly, Shapiro also holds the edge on handling issues which have generally helped Republicans in this midterm cycle, such as crime (46% to 33% for Mastriano) and immigration (43% to 34%) along with issues generally favorable toward Democrats, like abortion (48% Shapiro to 29% Mastriano).
The poll does not attempt to predict turnout, but past voter history metrics and self-reported motivation give a picture of a range of possible outcomes. Among voters who participated in the 2020 presidential election, more voters definitely (44%) or probably (10%) support Shapiro than those who definitely (25%) or probably (14%) support Mastriano. The Democrat also has an edge among those who voted in the 2018 “blue wave” midterm election, with support for Shapiro (47% definite and 9% probable) outpacing that for Mastriano (26% definite and 13% probable). Among the 2 in 3 voters who are extremely motivated to turn out this year, support for Shapiro (48% definite and 6% probable) is notably higher than for Mastriano (30% definite and 10% probable). Among voters who have already returned a mail ballot or intend to vote early – about one-quarter of the electorate – Shapiro has a clear edge with 71% backing him to just 16% for Mastriano. Those who plan to vote on Election Day are more evenly divided, with 46% backing the Democrat and 47% supporting the Republican.
“Pennsylvania will take some time to count its mail ballots. That means if the Election Day tally is close, Shapiro is almost certain to be headed for a solid win. But if Mastriano is ahead by double digits in the initial count, the final result could end being a lot closer than the polling metrics suggest,” said Murray.
Overall, 43% of Pennsylvania voters are very confident that the commonwealth’s election will be conducted fairly and accurately and another 34% are somewhat confident in this. Democrats (69%) are much more likely than Republicans (15%) to be very confident in how Pennsylvania will run the upcoming election. Just under half of independent voters (46%) are very confident in this.
The Monmouth University Poll was conducted by telephone from October 27 to 31, 2022 with 608 Pennsylvania registered voters. The question results in this release have a margin of error of +/- 4.5 percentage points for the full sample. The poll was conducted by the Monmouth University Polling Institute in West Long Branch, NJ.
QUESTIONS AND RESULTS
(* Some columns may not add to 100% due to rounding.)
[Q1-10 previously released.]
11/12.I am going to read you a list of candidates running for Governor in Pennsylvania this year. For each one, please tell me if you have definitely heard of them, not sure if you’ve heard of them, or if you’ve definitely not heard of them?
[If DEFINITELY HEARD OF:] Do you have a very favorable, somewhat favorable, somewhat unfavorable, or very unfavorable opinion of them? [NAMES WERE ROTATED]
| TREND: | Very favorable | Somewhat favorable | Somewhat unfavorable | Very unfavorable | Heard of, no opinion (VOL) | Not sure if heard of | Definitely not heard of | (n) |
| Doug Mastriano, the Republican | 20% | 15% | 12% | 40% | 5% | 3% | 4% | (608) |
| — Early Oct. 2022 | 19% | 18% | 8% | 41% | 5% | 2% | 6% | (610) |
| — Sept. 2022 | 18% | 18% | 9% | 39% | 5% | 3% | 9% | (605) |
| Josh Shapiro, the Democrat | 35% | 22% | 14% | 20% | 5% | 1% | 3% | (608) |
| — Early Oct. 2022 | 34% | 20% | 15% | 20% | 6% | 3% | 3% | (610) |
| — Sept. 2022 | 30% | 25% | 13% | 20% | 5% | 2% | 6% | (605) |
[QUESTIONS 13 & 14 WERE ROTATED]
13.How likely are you to vote for Doug Mastriano in the election for governor – will you definitely vote for him, probably vote for him, probably not vote for him, or definitely not vote for him?
| TREND: | Late Oct. 2022 | Early Oct. 2022 | Sept. 2022 |
| Definitely (or already voted for him) | 25% | 24% | 21% |
| Probably | 14% | 14% | 15% |
| Probably not | 8% | 13% | 14% |
| Definitely not (or already voted for someone else) | 49% | 45% | 45% |
| (VOL) Don’t know | 4% | 4% | 5% |
| (n) | (608) | (610) | (605) |
14.How likely are you to vote for Josh Shapiro in the election for governor – will you definitely vote for him, probably vote for him, probably not vote for him, or definitely not vote for him?
| TREND: | Late Oct. 2022 | Early Oct. 2022 | Sept. 2022 |
| Definitely (or already voted for him) | 43% | 40% | 33% |
| Probably | 9% | 14% | 21% |
| Probably not | 13% | 14% | 14% |
| Definitely not (or already voted for someone else) | 30% | 28% | 28% |
| (VOL) Don’t know | 4% | 4% | 5% |
| (n) | (608) | (610) | (605) |
15.How likely are you to vote for one of the third party candidates running for governor this year – will you definitely vote for one of them, probably vote for them, probably not vote for them, or definitely not vote for them?
| TREND: | Late Oct. 2022 | Oct. 2022 |
| Definitely (or already voted for them) | 3% | 2% |
| Probably | 9% | 9% |
| Probably not | 17% | 30% |
| Definitely not (or already voted for someone else) | 66% | 55% |
| (VOL) Don’t know | 5% | 4% |
| (n) | (608) | (610) |
[QUESTIONS 16 & 17 WERE ROTATED]
16.Are Doug Mastriano’s political views in line or out of step with most residents of Pennsylvania?
| TREND: | Late Oct. 2022 | Early Oct. 2022 |
| In line | 32% | 35% |
| Out of step | 54% | 51% |
| (VOL) Don’t know | 14% | 14% |
| (n) | (608) | (610) |
17.Are Josh Shapiro’s political views in line or out of step with most residents of Pennsylvania?
| TREND: | Late Oct. 2022 | Early Oct. 2022 |
| In line | 53% | 50% |
| Out of step | 34% | 34% |
| (VOL) Don’t know | 14% | 16% |
| (n) | (608) | (610) |
18.Who do you trust more on [READ ITEM] – Doug Mastriano, Josh Shapiro, both equally, or neither one? [ITEMS WERE ROTATED] [NAMES WERE ROTATED]
| Doug Mastriano | Josh Shapiro | Both equally | Neither one | (VOL) Don’t know | (n) | |
| Immigration | 34% | 43% | 4% | 14% | 5% | (608) |
| — Early Oct. 2022 | 34% | 44% | 7% | 12% | 4% | (610) |
| Gun control | 34% | 42% | 5% | 13% | 6% | (608) |
| — Early Oct. 2022 | 36% | 45% | 6% | 9% | 5% | (610) |
| Abortion | 29% | 48% | 3% | 15% | 5% | (608) |
| — Early Oct. 2022 | 27% | 50% | 5% | 11% | 6% | (610) |
| Jobs, the economy and cost of living | 32% | 46% | 7% | 12% | 3% | (608) |
| — Early Oct. 2022 | 34% | 47% | 7% | 8% | 3% | (610) |
| Defending your values | 32% | 48% | 4% | 12% | 4% | (608) |
| — Early Oct. 2022 | 33% | 47% | 8% | 9% | 3% | (610) |
| Crime | 33% | 46% | 5% | 12% | 4% | (608) |
| — Early Oct. 2022 | 34% | 47% | 8% | 7% | 3% | (610) |
| Elections and voting processes | 30% | 49% | 7% | 12% | 3% | (608) |
| — Early Oct. 2022 | 32% | 47% | 8% | 10% | 3% | (610) |
[Q19-20 previously released.]
21.Overall, how confident are you that the election in Pennsylvania will be conducted fairly and accurately – very confident, somewhat confident, not too confident, or not at all confident?
| TREND: | Late Oct. 2022 | Early Oct. 2022 |
| Very confident | 43% | 41% |
| Somewhat confident | 34% | 32% |
| Not too confident | 13% | 17% |
| Not at all confident | 8% | 10% |
| (VOL) Don’t know | 1% | 1% |
| (n) | (608) | (610) |
[Q22-30 previously released.]
METHODOLOGY
The Monmouth University Poll was sponsored and conducted by the Monmouth University Polling Institute from October 27 to 31, 2022 with a probability-based random sample of 608 Pennsylvania voters drawn from a list of active registered voters who participated in at least one general election since 2016 or have newly registered since the 2020 election. This includes 182 contacted by a live interviewer on a landline telephone and 426 contacted by a live interviewer on a cell phone, in English. Monmouth is responsible for all aspects of the survey design, data weighting and analysis. The full sample is weighted for party registration, age, gender, race, education, and region based on state voter registration list information and U.S. Census information (CPS 2018 supplement). Data collection support provided by Braun Research (field) and Aristotle (voter sample). For results based on this sample, one can say with 95% confidence that the error attributable to sampling has a maximum margin of plus or minus 4.5 percentage points (adjusted for sample design effects). Sampling error can be larger for sub-groups (see table below). In addition to sampling error, one should bear in mind that question wording and practical difficulties in conducting surveys can introduce error or bias into the findings of opinion polls.
| DEMOGRAPHICS (weighted) |
| REGISTERED VOTERS |
| Party Registration |
| 42% Republican |
| 14% Other/none |
| 44% Democrat |
| Self-Reported Party |
| 37% Republican |
| 27% Independent |
| 36% Democrat |
| 48% Male |
| 52% Female |
| 21% 18-34 |
| 22% 35-49 |
| 29% 50-64 |
| 28% 65+ |
| 83% White, non-Hispanic |
| 10% Black |
| 5% Hispanic |
| 2% Asian/other |
| 63% No degree |
| 37% 4 year degree |
Click on pdf file link below for full methodology and crosstabs by key demographic groups.