West Long Branch, NJ – The contest in Pennsylvania’s newly drawn 1st Congressional District remains tight, but Republican incumbent Brian Fitzpatrick has inched ahead of Democratic challenger Scott Wallace in the latest Monmouth University Poll of the race. Most PA-01 voters hold a negative view of President Donald Trump and a plurality say they would like to see Democrats take control of Congress. However, Fitzpatrick is able to counter these trends with a positive reputation among his constituents.
Fitzpatrick currently holds a 50% to 46% lead over Wallace among likely voters using Monmouth’s standard midterm turnout model. The race narrows to a virtual tie of 49% for Fitzpatrick and 48% for Wallace using a model that incorporates a turnout surge in Democratic precincts. A model projecting lower overall turnout shows Fitzpatrick with a larger 52% to 45% edge over Wallace. The race was much closer in Monmouth’s June poll when Fitzpatrick was ahead by a single point in the standard model (48%-47%), Wallace was ahead by a single point in the Democratic surge model (48%-47%), and the race was tied in the low turnout model (48%-48%). All the leads in the current likely voter models are within the margin of error for the poll.
Fitzpatrick currently has the edge among both male (51% to 46%) and female (50% to 47%) voters. His lead with men is smaller than it was in June (57% to 38%), but he has reversed a significant deficit among women (40% to 56% for Wallace) since the summer.
White voters without a college degree back Fitzpatrick by a 53% to 44% margin, which is smaller than the 58% to 37% lead he held in June. The Republican has made up for this by erasing the deficit he had with white college educated voters. This group is currently divided at 50% for Fitzpatrick and 49% for Wallace. In June, Wallace actually had a lead among college educated white voters of 54% to 42%. Black, Asian, and Latino voters back Wallace by 54% to 36% in the current poll, which is similar to his 58% to 36% standing with this group in June.
“When you look at the underlying political environment in this district, you would expect the Democrat to be ahead. But Fitzpatrick has been able to overcome this with a solid reputation among his constituents, while many remain uncertain about Wallace,” said Patrick Murray, director of the independent Monmouth University Polling Institute.
Half (50%) of PA-01 likely voters have a favorable view of Fitzpatrick compared to just 28% who have an unfavorable view, with 22% expressing no opinion. This is down slightly from the incumbent’s 59% favorable and 29% unfavorable rating in June, but this rating is still more positive than views of the challenger. Wallace currently earns a 38% favorable and 28% unfavorable rating, with 34% having no opinion. This is more negative than the Democrat’s June rating of 42% favorable and 22% unfavorable.
Fitzpatrick has an advantage over Wallace when it comes to being seen as in touch with the district. A majority of 56% say the incumbent is in touch with his constituents while 33% say he is not. Just over 4-in-10 (43%) say the challenger is in touch with PA-01 residents and 32% say he is not. These results are basically unchanged from June’s results of 58% in touch and 30% out of touch for Fitzpatrick and 39% in touch and 28% out of touch for Wallace.
“Republicans have been trying to paint the challenger as a carpetbagger. They may be having limited success on this score, and in a tight race that difference in comfort level might prove to be the margin of victory,” said Murray.
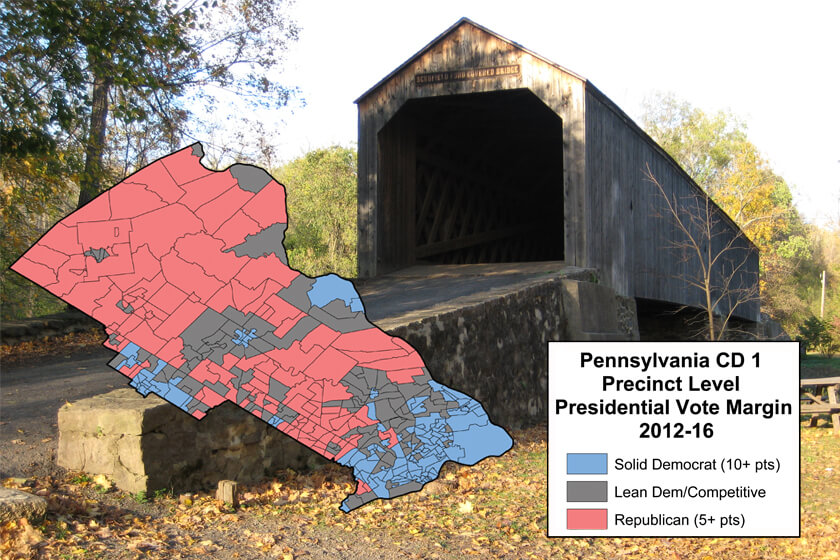
Many underlying indicators in this race point to what would be a Democratic advantage, starting with opinions of the president. A majority (54%) of PA-01 voters disapprove of the job Trump is doing compared with 43% who approve. Those who strongly disapprove (48%) significantly outnumber those who strongly approve (31%). Trump’s rating in June stood at 51% disapprove and 46% approve. Hillary Clinton won what now comprises Pennsylvania’s 1st Congressional District by 2 points in 2016 and Barack Obama won it by a single point over Mitt Romney in 2012.
The poll also finds that PA-01 voters express a slight preference for seeing Democrats (45%) rather than Republicans (40%) in control of Congress. This sentiment is basically unchanged from June when 46% preferred Democratic control and 41% preferred Republican control.
Just over 1-in-3 likely voters (36%) in Pennsylvania’s 1st District say Fitzpatrick has been too supportive of Trump, which is up somewhat from 29% who said the same in June. Conversely, 14% say the incumbent has not been supportive enough, which is down from 21% in June. Another 34% say Fitzpatrick has offered the right amount of support to Trump, which is up from 27% in June.
While the anti-Trump lean of the district has remained stable since the summer, Republicans have been able to narrow the partisan gap as it impacts turnout. Currently, 72% of likely voters say that the president is a very important factor in their House vote, including 77% of Trump opponents and 73% of Trump supporters. In June, a similar 74% said Trump was a very important factor, but there was a larger gap between opponents (84%) and supporters (72%) who felt this way.
“Even though Trump remains a drag on Fitzpatrick overall, the president’s supporters have grown a little more favorable toward the moderate incumbent, boosting potential turnout in the Republican base,” said Murray.
The poll finds that news about sexual assault allegations against Supreme Court nominee Brett Kavanaugh is not having much of an impact on this race. More than 8-in-10 likely PA-01 voters (83%) say that recent developments have not caused them to change their vote. Among the remainder, 8% say the Kavanaugh issue has made them more likely to support Wallace, 6% say it has made them more likely to support Fitzpatrick, and 2% say it has made them more undecided.
When asked to choose their top issue in the House race from a list of six included in the poll, health care (28%) emerges as the top pick, followed by immigration (19%), tax policy (12%), abortion (12%), job creation (11%), and gun control (11%). When asked who they trust more to keep health care affordable, 39% choose Wallace and 33% choose Fitzpatrick, with 20% saying they trust both candidates equally. When asked who they trust more to support policies that will keep their families safe, 40% choose Fitzpatrick and 30% choose Wallace, with 22% saying they trust both equally.
“This race depends largely on which electorate shows up on Election Day. If Republicans can keep the enthusiasm gap close, Fitzpatrick should be re-elected. But if the underlying partisan lean of this district on national issues charges up the Democratic base, Wallace has a shot,” said Murray.
The Monmouth University Poll was conducted by telephone from September 27 to October 1, 2018 with 353 likely voters in Pennsylvania’s 1st Congressional District. The question results in this release have a margin of error of +/- 5.2 percentage points. The error of the difference between the two candidates’ vote share (i.e. the “lead”) is +/-7.4 percentage points. The poll was conducted by the Monmouth University Polling Institute in West Long Branch, NJ.
QUESTIONS AND RESULTS
(* Some columns may not add to 100% due to rounding.)
1/2. If the election for U.S. House of Representatives in your district was today, would you vote for Brian Fitzpatrick the Republican or Scott Wallace the Democrat? [IF UNDECIDED: If you had to vote for one of the following at this moment, do you lean more toward Brian Fitzpatrick or more toward Scott Wallace?] [NAMES WERE ROTATED]
| Likely Voters
with leaners | Oct. 2018 | June 2018 | ||||
| Standard | Democratic | Low Turnout | Standard | Democratic | Low Turnout | |
| Brian Fitzpatrick | 50% | 49% | 52% | 48% | 47% | 48% |
| Scott Wallace | 46% | 48% | 45% | 47% | 48% | 48% |
| (VOL) Other | 1% | 1% | 1% |
<1% |
<1% |
<1% |
| (VOL) Undecided | 3% | 3% | 2% | 5% | 5% | 4% |
| (n) | (353) | (353) | (353) | (254) | (254) | (254) |
[QUESTIONS 3 & 4 WERE ROTATED]
3. Is your general impression of Brian Fitzpatrick favorable or unfavorable, or do you have no opinion of him?
| Likely Voter Standard | Oct. 2018 | June 2018 |
| Favorable | 50% | 59% |
| Unfavorable | 28% | 29% |
| No opinion | 22% | 12% |
| (n) | (353) | (254) |
4. Is your general impression of Scott Wallace favorable or unfavorable, or do you have no opinion of him?
| Likely Voter Standard | Oct. 2018 | June 2018 |
| Favorable | 38% | 42% |
| Unfavorable | 28% | 22% |
| No opinion | 34% | 36% |
| (n) | (353) | (254) |
5. How much interest do you have in the upcoming election for House of Representatives – a lot of interest, a little interest, or not much interest at all?
| Likely Voter Standard | Oct. 2018 | June 2018 |
| A lot | 76% | 84% |
| A little | 20% | 16% |
| Not much at all | 3% | 0% |
| (VOL) Don’t know | 1% | 0% |
| (n) | (353) | (254) |
6. Have you been following the campaign in your congressional district very closely, somewhat closely, or not too closely?
| Likely Voter Standard | Oct. 2018 | June 2018 |
| Very closely | 29% | 27% |
| Somewhat closely | 46% | 58% |
| Not too closely | 24% | 15% |
| (VOL) Don’t know | 0% | 0% |
| (n) | (353) | (254) |
7. Do you approve or disapprove of the job Donald Trump is doing as president? [Do you (approve/disapprove) strongly or somewhat?]
| Likely Voter Standard | Oct. 2018 | June 2018 |
| Strongly approve | 31% | 33% |
| Somewhat approve | 12% | 13% |
| Somewhat disapprove | 6% | 4% |
| Strongly disapprove | 48% | 47% |
| (VOL) Don’t know | 2% | 3% |
| (n) | (353) | (254) |
8. On most issues would you say you support or oppose what President Trump is doing?
| Likely Voter Standard | Oct. 2018 | June 2018 |
| Support | 44% | 44% |
| Oppose | 52% | 51% |
| (VOL) Depends/both | 3% | 3% |
| (VOL) Don’t know | 1% | 2% |
| (n) | (353) | (254) |
9. How important is it for you to cast a vote for Congress that shows your [support of/opposition to] President Trump – very important, somewhat important, not too important, or not at all important?
| Likely Voter Standard | Oct. 2018 | June 2018 |
| Very important | 72% | 74% |
| Somewhat important | 13% | 14% |
| Not too important | 3% | 3% |
| Not at all important | 5% | 3% |
| (VOL) Don’t know | 6% | 6% |
| (n) | (353) | (254) |
10. Would you rather see the Republicans or the Democrats in control of Congress, or doesn’t this matter to you?
| Likely Voter Standard | Oct. 2018 | June 2018 |
| Republicans | 40% | 41% |
| Democrats | 45% | 46% |
| Does not matter | 13% | 11% |
| (VOL) Don’t know | 2% | 2% |
| (n) | (353) | (254) |
11. Has Brian Fitzpatrick been too supportive of Donald Trump, not supportive enough, or has he given the right amount of support to Trump?
| Likely Voter Standard | Oct. 2018 | June 2018 |
| Too supportive | 36% | 29% |
| Not supportive enough | 14% | 21% |
| Right amount of support | 34% | 27% |
| (VOL) Don’t know | 17% | 23% |
| (n) | (353) | (254) |
12. Please tell me which one of the following policy issues is most important to you in your vote choice for Congress? [ITEMS WERE ROTATED]
| Likely Voter Standard | Oct. 2018 |
| Immigration policy | 19% |
| Health care policy | 28% |
| Gun control policy | 11% |
| Abortion policy | 12% |
| Tax policy | 12% |
| Job creation policy | 11% |
| (VOL) Other | 5% |
| (VOL) Don’t know | 3% |
| (n) | (353) |
[QUESTIONS 13 & 14 WERE ROTATED]
13. Who do you trust more to work to keep health care affordable – Brian Fitzpatrick or Scott Wallace, or do you trust both equally? [NAMES WERE ROTATED]
| Likely Voter Standard | Oct. 2018 |
| Brian Fitzpatrick | 33% |
| Scott Wallace | 39% |
| Both equally | 20% |
| (VOL) Neither one | 4% |
| (VOL) Don’t know | 5% |
| (n) | (353) |
14. Who do you trust more to support policies that will keep your family safe – Brian Fitzpatrick or Scott Wallace, or do you trust both equally? [NAMES WERE ROTATED]
| Likely Voter Standard | Oct. 2018 |
| Brian Fitzpatrick | 40% |
| Scott Wallace | 30% |
| Both equally | 22% |
| (VOL) Neither one | 3% |
| (VOL) Don’t know | 4% |
| (n) | (353) |
[QUESTIONS 15 & 16 WERE ROTATED]
15. Do you think Brian Fitzpatrick is in touch or out of touch with the residents of this district?
| Likely Voter Standard | Oct. 2018 | June 2018 |
| In touch | 56% | 58% |
| Out of touch | 33% | 30% |
| (VOL) Don’t know | 11% | 12% |
| (n) | (353) | (254) |
16. Do you think Scott Wallace is in touch or out of touch with the residents of this district?
| Likely Voter Standard | Oct. 2018 | June 2018 |
| In touch | 43% | 39% |
| Out of touch | 32% | 28% |
| (VOL) Don’t know | 25% | 34% |
| (n) | (353) | (254) |
17. There have been recent hearings and other news about sexual assault allegations against Supreme Court nominee Brett Kavanaugh. Has anything you heard in the last week caused you to change your mind about who you will support in the election for House of Representatives, or hasn’t it changed your mind? [If “YES”: Has this made you more likely to support Fitzpatrick, more likely to support Wallace or has it made you more undecided?]
| Likely Voter Standard | Oct. 2018 |
| Yes, more likely to support Fitzpatrick | 6% |
| Yes, more likely to support Wallace | 8% |
| Yes, more undecided | 2% |
| No, has not changed my mind | 83% |
| (VOL) Not aware of allegations/news | 1% |
| (VOL) Don’t know | 1% |
| (n) | (353) |
METHODOLOGY
The Monmouth University Poll was sponsored and conducted by the Monmouth University Polling Institute from September 27 to October 1, 2018 with a random sample of 353 likely voters in Pennsylvania’s 1st Congressional District, drawn from a list of registered voters who voted in at least one of the last four general or primary elections or have registered to vote since January 2016. This includes 207 contacted by a live interviewer on a landline telephone and 146 contacted by a live interviewer on a cell phone in English. Monmouth is responsible for all aspects of the survey design, data weighting and analysis. Final sample is weighted for region, party registration, age, gender, education and race based on state voter registration list and U.S. Census information. Data collection support provided by Braun Research (field) and L2 (voter sample). For results based on this sample, one can say with 95% confidence that the error attributable to sampling has a maximum margin of plus or minus 5.2 percentage points (unadjusted for sample design). Sampling error can be larger for sub-groups (see table below). In addition to sampling error, one should bear in mind that question wording and practical difficulties in conducting surveys can introduce error or bias into the findings of opinion polls.
| DEMOGRAPHICS (weighted) |
Party Registration |
| 45% Republican |
| 45% Democrat |
| 10% Neither |
Self-Reported Party ID |
| 38% Republican |
| 27% Independent |
| 35% Democrat |
| 49% Male |
| 51% Female |
| 11% 18-34 |
| 20% 35-49 |
| 34% 50-64 |
| 35% 65+ |
| 91% White, non-Hispanic |
9% Othe |
| 56% No college degree |
| 44% 4-year college degree |
| 90% Bucks County |
| 10% Montgomery County |
Click on pdf file link below for full methodology and results by key demographic groups.