West Long Branch, NJ – Donald Trump’s approval rating has held fairly steady since the last Monmouth University Poll despite recent revelations that family members and campaign aids met with Russian operatives during the 2016 campaign. In fact, concern about Russia’s influence in the White House has barely budged in the past two months. About 4-in-10 Americans currently support impeaching Trump six months into his term, which is significantly higher than the number who called for Richard Nixon’s impeachment six months into that president’s second term.
The president’s job rating currently stands at a net negative 39% approve and 52% disapprove. This is nearly identical to his 39%-53% rating in May. About one-third (32%) of the public says Pres. Trump’s agenda so far has focused a lot on issues that are important to average Americans, another 31% say he has focused a little on these issues and 35% say he has not focused at all on issues important to average Americans. These results are largely unchanged from two months ago.
“Donald Trump’s job rating has basically held steady amid another round of supposedly damaging news. Most Americans disapprove of his son and other advisers meeting with a Russian lawyer during the 2016 campaign, but that hasn’t really moved the needle on any other public opinion metric related to the president,” said Patrick Murray, director of the independent Monmouth University Polling Institute.
More than three-quarters (80%) of the public have heard last week’s news about the 2016 meeting between Trump campaign advisers, including the president’s son, and a Russian lawyer. Most Americans (59%) say the meeting was not appropriate, while just 31% say it was appropriate.
Most say that the Trump team went into the meeting expecting to obtain negative information on Hillary Clinton – 50% say this was the main purpose for the meeting and another 6% volunteer that this was one of the reasons for the meeting. One-third (33%) believe the meeting was for some other reason. Among those who believe the Trump team walked into the meeting expecting to get dirt on Clinton, 21% say attending was appropriate and 76% say it was not appropriate. Among those who say the Trump team believed the meeting was for another reason altogether, 49% say having the meeting was appropriate while 40% still say it was inappropriate to meet with the Russians during the campaign.
The president’s son-in-law Jared Kushner, who is now an unpaid White House adviser with access to classified information, was also at that 2016 meeting. The public is divided on whether Kushner should be made to resign (39%), lose his security clearance but keep his position (22%), or be able to continue in his current role with no change to his clearance (31%).
Nearly two-thirds of the public believes the Russian government either definitely (36%) or probably (29%) tried to interfere in the 2016 presidential election. Just over 1-in-4 say the Russians probably (18%) or definitely (10%) did not interfere. Given the premise that Russia did in fact try to interfere in the election, most believe this caused either a lot (47%) or a little (21%) damage to American democracy. Another 28%, on the other hand, believe that Russian interference did no damage to American democracy. This opinion is driven by a huge partisan divide. Specifically, 60% of Republicans believe that Russian interference in the election caused no damage at all to American democracy while only 28% of independents and 6% of Democrats feel the same.
“We’d like to believe that concerns about external interference in our democratic processes would unite Americans regardless of ideology. But in an era of partisan tribalism, it looks like short-term political ends justify the means,” said Murray.
A majority (54%) of Americans are concerned that Trump may be too friendly toward Russia. This level of concern has been creeping up from 45% during the 2016 campaign to 48% in the first months of Trump’s presidency, and 51% two months ago when Trump fired former FBI director James Comey. A similar majority (55%) of the public is concerned that other members of the Trump administration may be too friendly toward Russia. This number is up slightly from 49% in May.
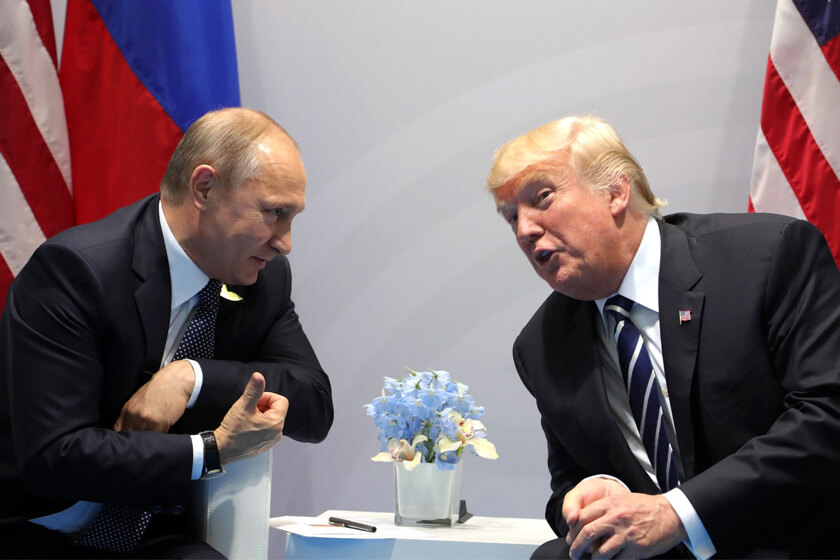
The public is divided on whether Pres. Trump pressed his Russian counterpart, Vladimir Putin, about that government’s interference in the U.S. election when the two met in person earlier this month. Just under half – 46% – say it is either very likely (20%) or somewhat likely (26%) that Trump did this, while a similar number – 48% – say it is not too likely (22%) or not at all likely (26%).
The public continues to be split on whether Trump’s attitude toward Russia does (48%) or does not (48%) present a national security threat to the United States. This opinion is nearly identical to the May poll results, when 48% said Trump’s position toward Russia poses a security risk and 46% said it does not.
Over 6-in-10 (62%) Americans say the special counsel investigation into Russian interference should continue while 33% say it should be brought to an end. Two months ago, 73% supported continuing the related FBI investigation into Russia – before the special counsel was appointed – and 24% wanted it to end.
Currently, 41% of the public think that Trump should be impeached and compelled to leave the presidency, while 53% disagree. The Monmouth University Poll asked the same question used by the Gallup Poll during Nixon’s presidency. In July 1973 as the Watergate scandal started to unfold, just 24% of the public supported impeachment and 62% were opposed. Support for Nixon’s impeachment was significantly lower six months into his second term as president than it is for the incumbent today. Interestingly, Nixon’s job rating at that point in his tenure – 39% approve and 49% disapprove – was about the same as Trump’s current rating.
“Even though Trump’s approval rating is similar to Nixon’s, more Americans support impeachment today than did in 1973. That’s partly due to the current epidemic of hyper-partisanship that was simply not prevalent forty years ago,” said Murray. [Note: the 1973 Gallup dataset was obtained from the Roper Center for Public Opinion Research archives. Murray’s blog post on the history of Gallup’s impeachment polling during Watergate can be found here.]
Just 34% of Democrats supported impeaching Nixon in the summer of 1973, compared to 70% of Democrats who support impeaching Trump today. There are much smaller differences in support for impeachment of the two presidents among independents (22% for Nixon and 32% for Trump) and Republicans (7% for Nixon and 12% for Trump). Another difference in the two polls that underlines today’s partisan tribalism is that Nixon had a higher approval rating than Trump among Democrats (24% versus 7% for Trump) and a lower approval rating than Trump among his fellow Republicans (67% versus 79% for Trump). Approval among independents was the same for Nixon in 1973 (41%) as it is for Trump today (41%).
The Monmouth University Poll was conducted by telephone from July 13 to 16, 2017 with 800 adults in the United States. The results in this release have a margin of error of +/- 3.5 percent. The poll was conducted by the Monmouth University Polling Institute in West Long Branch, NJ.
QUESTIONS AND RESULTS
(* Some columns may not add to 100% due to rounding.)
undefined. Do you approve or disapprove of the job Donald Trump is doing as president?
| TREND: | July 2017 | May 2017 | March 2017 |
| Approve | 39% | 39% | 43% |
| Disapprove | 52% | 53% | 46% |
| (VOL) No opinion | 9% | 8% | 11% |
| (n) | (800) | (1,002) | (801) |
[Q2-6 held for future release.]
7. How much has Donald Trump’s agenda during his first months in office focused on the issues important to average Americans – a lot, a little, or not at all?
| July 2017 | May 2017 | March 2017 | |
| A lot | 32% | 35% | 42% |
| A little | 31% | 30% | 28% |
| Not at all | 35% | 32% | 27% |
| (VOL) Don’t know | 2% | 3% | 4% |
| (n) | (800) | (1,002) | (801) |
8. Do you think President Trump should be impeached and compelled to leave the Presidency, or not?
| July 2017 | |
| Yes, should | 41% |
| No, should not | 53% |
| (VOL) Don’t know | 6% |
| (n) | (800) |
9. Are you concerned or not concerned that Donald Trump may be too friendly toward Russia? [If CONCERNED: Are you concerned a lot or a little?]
| TREND: | July 2017 | May 2017 | March 2017 | Jan. 2017 | Aug. 2016* |
| Concerned, a lot | 38% | 39% | 37% | 33% | 32% |
| Concerned, a little | 16% | 12% | 11% | 15% | 13% |
| Not concerned | 44% | 45% | 49% | 48% | 49% |
| (VOL) Don’t know | 3% | 4% | 3% | 3% | 3% |
| (n) | (800) | (1,002) | (801) | (801) | (803) |
* Registered voters
10. Are you concerned or not concerned that other members of the Trump administration may be too friendly toward Russia? [If CONCERNED: Are you concerned a lot or a little?]
| July 2017 | March 2017 | |
| Concerned, a lot | 42% | 38% |
| Concerned, a little | 13% | 11% |
| Not concerned | 43% | 48% |
| (VOL) Don’t know | 3% | 3% |
| (n) | (800) | (801) |
11. Do you think Trump’s attitude toward Russia does or does not present a national security threat to the U.S.?
| July 2017 | May 2017 | |
| Does | 48% | 48% |
| Does not | 48% | 46% |
| (VOL) Don’t know | 4% | 7% |
| (n) | (800) | (1,002) |
12. Have you heard that a special counsel is conducting an investigation into Russian interference in the 2016 election and possible links with the Trump campaign, or haven’t you heard about this?
| July 2017 | |
| Heard | 86% |
| Not Heard | 14% |
| (n) | (800) |
13. Should the Russia investigation continue or should it end?
| July 2017 | May 2017* | |
| Continue | 62% | 73% |
| End | 33% | 24% |
| (VOL) Don’t know | 5% | 3% |
| (n) | (800) | (1,002) |
[* May’17 question was asked about the then-ongoing FBI investigation.]
14. Do you think the Russian government tried to interfere in the 2016 presidential election – would you say definitely, probably, probably not, or definitely not?
| July 2017 | |
| Definitely | 36% |
| Probably | 29% |
| Probably not | 18% |
| Definitely not | 10% |
| (VOL) Don’t know | 6% |
| (n) | (800) |
15. If Russia did interfere in the election, how much damage did it cause to American democracy – a lot, a little, or none at all?
| July 2017 | |
| A lot | 47% |
| A little | 21% |
| None at all | 28% |
| (VOL) Don’t know | 4% |
| (n) | (800) |
16. Were you aware that President Trump had a one-on-one meeting with Russian President Vladimir Putin at a conference of world leaders last week, or haven’t you heard about this?
| July 2017 | |
| Aware | 83% |
| Not heard | 17% |
| (n) | (800) |
17. Based on what you may know or think about it, how likely is it that Trump really pressed Putin about Russian interference in the 2016 election at this meeting – very likely, somewhat likely, not too likely, or not at all likely?
| July 2017 | |
| Very likely | 20% |
| Somewhat likely | 26% |
| Not too likely | 22% |
| Not at all likely | 26% |
| (VOL) Don’t know | 6% |
| (n) | (800) |
18. Have you heard that the president’s son Donald Trump, Jr. and other advisers met with a Russian lawyer during the 2016 campaign, or haven’t you heard about this?
| July 2017 | |
| Heard | 80% |
| Not heard | 20% |
| (n) | (800) |
19. Do you think that it was appropriate or not appropriate for the Trump advisers to have this meeting?
| July 2017 | |
| Appropriate | 31% |
| Not appropriate | 59% |
| (VOL) Don’t know | 10% |
| (n) | (800) |
20. Do you think the Trump campaign advisers agreed to this meeting because they expected to get negative information about Hillary Clinton from the Russian government, or were they meeting for some other reason?
| July 2017 | |
| Get negative information on Hillary Clinton | 50% |
| For some other reason | 33% |
| (VOL) Both | 6% |
| (VOL) Don’t know | 11% |
| (n) | (800) |
21. If the Trump campaign advisers did agree to this meeting specifically because they expected to get negative information about Hillary Clinton from the Russian government, do you think what they did was wrong or not wrong?
| July 2017 | |
| Wrong | 62% |
| Not wrong | 29% |
| (VOL) Don’t know | 8% |
| (n) | (800) |
22. One of the advisers in the meeting was the president’s son-in-law Jared Kushner. He is currently an unpaid White House senior aide with security clearance that gives him access to classified information. Should Kushner have to resign from his position, be able to keep his position but lose his security clearance, or be able to keep both his position and his security clearance?
| July 2017 | |
| Resign from his position | 39% |
| Keep his position but lose his security clearance | 22% |
| Keep both his position and his security clearance | 31% |
| (VOL) Don’t know | 8% |
| (n) | (800) |
[Q23-28 held for future release.]
METHODOLOGY
The Monmouth University Poll was sponsored and conducted by the Monmouth University Polling Institute from July 13 to 16, 2017 with a national random sample of 800 adults age 18 and older, in English. This includes 400 contacted by a live interviewer on a landline telephone and 400 contacted by a live interviewer on a cell phone. Telephone numbers were selected through random digit dialing and landline respondents were selected with a modified Troldahl-Carter youngest adult household screen. Monmouth is responsible for all aspects of the survey design, data weighting and analysis. Final sample is weighted for region, age, education, gender and race based on US Census information. Data collection support provided by Braun Research (field) and SSI (RDD sample). For results based on this sample, one can say with 95% confidence that the error attributable to sampling has a maximum margin of plus or minus 3.5 percentage points (unadjusted for sample design). Sampling error can be larger for sub-groups (see table below). In addition to sampling error, one should bear in mind that question wording and practical difficulties in conducting surveys can introduce error or bias into the findings of opinion polls.
| DEMOGRAPHICS (weighted) |
|
Self-Reported |
| 26% Republican |
| 40% Independent |
| 34% Democrat |
| 49% Male |
| 51% Female |
| 31% 18-34 |
| 34% 35-54 |
| 35% 55+ |
| 65% White |
| 12% Black |
|
15% Hispanic |
|
8% Asian/Other |
Click on pdf file link below for full methodology and results by key demographic groups.


