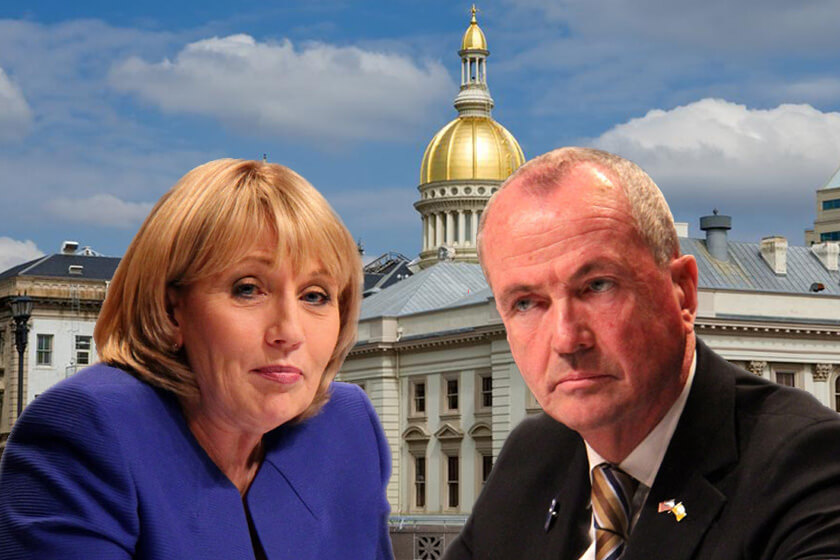
West Long Branch, NJ – As the race for New Jersey’s next governor shifts into high gear, the Monmouth University Poll finds former ambassador Phil Murphy with a daunting 27 point lead over the state’s lieutenant governor Kim Guadagno. Neither candidate is particularly well known, though. The poll also found that fixing the state’s highest-in-the nation property taxes is the top priority for Garden State voters this election year, although a range of other issues are also viewed as important.
Among all registered voters in New Jersey, a majority (53%) say they would vote for Murphy and 26% would choose Guadagno if the election for governor was today. Another 6% select an independent candidate and 14% are undecided. Murphy currently gets stronger support from his fellow Democrats (87%) than Guadagno does from her fellow Republicans (69%). Independents split 41% for Murphy and 28% for Guadagno.
“Party labels are the primary driver behind this early reading of the race since very few voters really know much about either candidate. It is not clear whether Guadagno’s fortunes will improve as voters learn more about her current role as lieutenant governor considering how unpopular Chris Christie is right now. At the same time, something unfavorable could come out about Murphy, but the underlying partisan fundamentals of the state are working against the Republican right now,” said Patrick Murray, director of the independent Monmouth University Polling Institute.
While most New Jersey voters are able to make a choice for governor, 6-in-10 say they really don’t know enough about either nominee to form an opinion. Voters are split on Guadagno at 18% favorable and 21% unfavorable, with 61% having no opinion of her. Murphy does somewhat better at 29% favorable and 12% unfavorable, with 59% having no opinion of him.
“These results represent the current views of all registered voters at a very early stage of the campaign. Most of the candidates’ support is fairly soft at this point and turnout will be significantly smaller than the full population of registered voters polled here, so anything could happen,” said Murray, noting that Monmouth will transition to a tighter likely voter sample for subsequent polling of this race.
The poll also asked voters to name the most important issues currently facing New Jersey and found that fully half (50%) identify the state’s highest-in-the-nation property taxes as their most pressing concern. This ranks well ahead of all other issues, with the next tier of items including public education (15%), jobs (13%), and health insurance (11%). There are some partisan differences in the number of voters who mention these issues as most important to them. For example, 64% of Republicans identify property taxes as the top issue while 11% mention education. A majority of independents (53%) name property taxes with 10% mentioning education. About 4-in-10 Democrats (39%) cite property taxes as their top issue while 22% name public education.
“Monmouth has been tracking New Jerseyans’ policy concerns for years and the state’s onerous property tax burden is one that just won’t go away. The next governor faces many obstacles and priorities, but voters are clear on which issue they want tackled first,” said Murray.
The number of voters who point to property taxes as New Jersey’s most pressing issue now is slightly higher than it was at this point in the 2009 gubernatorial race, when 45% put this concern in the number one slot. That number declined to 32% in late 2012 and 27% in late 2013 as the state dealt with the aftermath of Superstorm Sandy and continuing economic doldrums, but the property tax issue has firmly retaken the top spot in time for the 2017 gubernatorial election.
Eight years ago in the throes of a major economic downturn, the economy (27%) and jobs (18%) ranked much more highly than they do today. Jobs concerns actually climbed to 41% who mentioned it as the state’s top problem in early 2012 and actually took the top spot from property taxes in late 2013 when it registered 36%.
The number of Garden State voters who name health care and insurance as a top issue is down from 18% in 2009 to 11% today. State spending was also cited by more voters eight years ago (18%) than it is today (9%). Public education mentions were about the same in 2009 (12%) as they are currently (15%). Concerns about transportation infrastructure, which were not that prevalent eight years ago (1%), are now named by 1-in-10 voters (10%) as one of the state’s top issues.
The Monmouth University Poll asked New Jersey voters to rate the importance of six specific issue areas for the next governor to focus on. Five of the six were rated as very important by at least 3-in-4 voters, including creating jobs (84%), making health care more affordable (83%), cutting property taxes (80%), improving schools (77%), and cutting government waste (76%). Six-in-ten voters (60%) say improving transportation infrastructure is a very important task for the next governor.
When asked to choose which of these six is the most important one for the next governor to tackle, 30% select property taxes, 20% choose health care, 18% pick schools, 13% choose government waste, 12% pick jobs, and 6% select transportation. Among political independents, property taxes is the highest priority (30%), with health care (18%), schools (17%), and government waste (16%) grouped in the second tier. Among Republicans, property taxes is most important (47%), followed by government waste (22%). Three items are grouped together as Democrats’ top priority for the next governor from among the six mentioned in the poll – specifically health care (26%), schools (23%), and property taxes (23%).
The Monmouth University Poll was conducted by telephone from July 6 to 9, 2017 with 758 New Jersey registered voters. The results in this release have a margin of error of +/- 3.6 percent. The poll was conducted by the Monmouth University Polling Institute in West Long Branch, NJ.
QUESTIONS AND RESULTS
(* Some columns may not add to 100% due to rounding.)
[Q1 held for future release. Q2-6 previously released.]
7. In your opinion, what are the most important one or two issues facing the state of New Jersey right now? [LIST WAS NOT READ] [Note: Results add to more than 100% because multiple responses were accepted.]
| TREND: Registered voters | July 2017 | Dec. 2013 | Dec. 2012 | Feb. 2012 | July 2009* |
| Property taxes | 50% | 27% | 32% | 44% | 45% |
| Income tax | 9% | 8% | 6% | 8% | 7% |
| Sales tax | 7% | 2% | 3% | 3% | 4% |
| Other tax, general taxes | 5% | 14% | 6% | 3% | 5% |
| Jobs | 13% | 36% | 28% | 41% | 18% |
| Economy, cost of living | 9% | 10% | 21% | 20% | 27% |
| State budget, govt. spending | 9% | 5% | 6% | 9% | 18% |
| Education/public schools | 15% | 22% | 11% | 19% | 12% |
| Higher education | 2% | 2% | 2% | 3% | n/a |
| Same-sex marriage | n/a | 1% | 1% | 2% | n/a |
| Transportation, infrastructure | 10% | 2% | 3% | 1% | 1% |
| Environment | 5% | 1% | 2% | 1% | 2% |
| Health insurance, care | 11% | 10% | 8% | 4% | 18% |
| Crime, guns, drugs | 9% | 5% | 3% | 5% | 2% |
| Public pensions/benefits | 6% | 2% | 2% | 2% | n/a |
| Housing | 6% | 3% | 2% | 1% | n/a |
| Illegal immigration | 3% | 1% | 1% | 1% | 2% |
| Auto insurance | 3% | 0% | 1% | 1% | n/a |
| Superstorm Sandy recovery | n/a | 7% | 24% | n/a | n/a |
| Gov. Chris Christie | 5% | n/a | n/a | n/a | n/a |
| Legalize marijuana | 2% | n/a | n/a | n/a | n/a |
| Opioid crisis | 1% | n/a | n/a | n/a | n/a |
| Other | 8% | 8% | 2% | 5% | 7% |
| Nothing/no answer | 3% | 3% | 4% | 3% | 3% |
| (n) | (758) | (698) | (726) | (709) | (792) |
[*Question wording in July 2009 was “In your opinion, what are the most important one or two issues that the candidates for governor should talk about?”]
[Q8-15 previously released.]
16/17. A new governor of New Jersey will be elected in November. If the election for governor was today, would you vote for Kim Guadagno the Republican, Phil Murphy the Democrat, or some other candidate? [IF UNDECIDED: If you had to vote for one of the following at this moment, do you lean more toward Kim Guadagno or more toward Phil Murphy?] [NAMES WERE ROTATED]
| Registered voters with leaners | July 2017 |
| Kim Guadagno, the Republican | 26% |
| Phil Murphy, the Democrat | 53% |
| Other candidate | 6% |
| (VOL) Undecided | 14% |
| (VOL) Not vote | 1% |
| (n) | (758) |
[QUESTIONS 18 & 19 WERE ROTATED]
18. Is your general impression of Kim Guadagno favorable or unfavorable, or do you have no opinion of her?
| July 2017 | |
| Favorable | 18% |
| Unfavorable | 21% |
| No opinion | 61% |
| (n) | (758) |
19. Is your general impression of Phil Murphy favorable or unfavorable, or do you have no opinion of him?
| July 2017 | |
| Favorable | 29% |
| Unfavorable | 12% |
| No opinion | 59% |
| (n) | (758) |
20. I’m going to read you a list of issues. For each one, please tell me whether it is very important, somewhat important, or not important for the next governor to focus on. [ITEMS WERE ROTATED]
Cutting property taxes
| July 2017 | |
| Very important | 80% |
| Somewhat important | 16% |
| Not too important | 3% |
| (VOL) Don’t know | 0% |
| (n) | (758) |
Creating jobs
| July 2017 | |
| Very important | 84% |
| Somewhat important | 14% |
| Not too important | 2% |
| (VOL) Don’t know | 0% |
| (n) | (758) |
Improving schools
| July 2017 | |
| Very important | 77% |
| Somewhat important | 18% |
| Not too important | 4% |
| (VOL) Don’t know | 0% |
| (n) | (758) |
Making health care more affordable
| July 2017 | |
| Very important | 83% |
| Somewhat important | 13% |
| Not too important | 4% |
| (VOL) Don’t know | 0% |
| (n) | (758) |
Cutting waste in state government
| July 2017 | |
| Very important | 76% |
| Somewhat important | 20% |
| Not too important | 3% |
| (VOL) Don’t know | 1% |
| (n) | (758) |
Improving transportation infrastructure
| July 2017 | |
| Very important | 60% |
| Somewhat important | 34% |
| Not too important | 5% |
| (VOL) Don’t know | 1% |
| (n) | (758) |
21. If you had to pick just one of these issues for the next governor to focus on, which would you choose – cutting property taxes, creating jobs, improving schools, making health care more affordable, cutting waste in state government, or improving transportation infrastructure? [ITEMS WERE ROTATED]
| July 2017 | |
| Cutting property taxes | 30% |
| Creating jobs | 12% |
| Improving schools | 18% |
| Making health care more affordable | 20% |
| Cutting waste in state government | 13% |
| Improving transportation infrastructure | 6% |
| (VOL) None of these/other | 0% |
| (VOL) Don’t know | 1% |
| (n) | (758) |
[Q22-25 held for future release. Q26-28 previously released.]
METHODOLOGY
The Monmouth University Poll was sponsored and conducted by the Monmouth University Polling Institute from July 6 to 9, 2017 with a random sample of 800 New Jersey adults age 18 and older, in English. This includes 493 contacted by a live interviewer on a landline telephone and 307 contacted by a live interviewer on a cell phone. Telephone numbers were selected through random digit dialing and landline respondents were selected with a modified Troldahl-Carter youngest adult household screen. Monmouth is responsible for all aspects of the survey design, data weighting and analysis. Final sample is weighted for region, age, education, gender and race based on US Census information. Data collection support provided by Braun Research (field) and SSI (RDD sample). The results in this poll release are based on a subsample of 758 registered voters. For results based on this sample, one can say with 95% confidence that the error attributable to sampling has a maximum margin of plus or minus 3.6 percentage points (unadjusted for sample design). Sampling error can be larger for sub-groups (see table below). In addition to sampling error, one should bear in mind that question wording and practical difficulties in conducting surveys can introduce error or bias into the findings of opinion polls.
| DEMOGRAPHICS (weighted) |
|
REGISTERED VOTERS |
|
Self-Reported |
| 20% Republican |
| 40% Independent |
| 40% Democrat |
| 46% Male |
| 54% Female |
| 25% 18-34 |
| 37% 35-54 |
| 37% 55+ |
| 64% White |
| 11% Black |
|
17% Hispanic |
|
8% Asian/Other |
Click on pdf file link below for full methodology and results by key demographic groups.


