by Patrick Murray
At the Monmouth University Poll, we have never shied away from taking responsibility when we’ve been wrong, so it only seems fair to recap when we got it right as well. However, more than taking a bow, there are lessons to be learned about election polling from our 2022 experience.
Most established pollsters only made minor methodological changes this year, in part because there is no clear evidence for a methodological fault behind the polling miss in 2020. Good pollsters don’t make changes to methodology based on a guess about partisan skew. After examining our 2020 and 2021 Monmouth polls, we made a minor but important methodological modification by simplifying our sample weighting matrix and a major alteration to our election framing in the way we present the “horse race” and likely voter estimates.
Let’s take the latter alteration to our vote choice presentation first. The media is so obsessed with the “horse race” and likely voter models that it’s difficult to get them to focus on the context issues covered in our polls. The big problem with likely voter models is they are simply educated guesses at what a voter population will look like. This violates rule number one of sampling: you need to know who is in your population before you start polling. Predictive likely voter modeling is fundamentally a different exercise than public opinion polling (i.e., finding out what a known population is thinking right now). As such, Monmouth did not provide a typical likely voter model in our polling this year, but we did present the results for different subsets of the electorate based on past voting turnout and some key metrics from the poll questions (more on that below). Educated readers of our poll reports were free to pick their own scenario from among those possibilities – or develop their own models.
The other change Monmouth made this year is in how we measured candidate support. Horse race polls are not judged on the range of support shown for a candidate – i.e., each candidate’s vote share plus or minus a margin of error – but on assessing the size of the gap between the two candidates’ shares. This obsession with “the gap” is fraught with potential error. I’ve talked ad nauseam about the media’s perceptual difference of small leads being “wrong” when compared with final election results because they don’t understand the amount of error inherent when one candidate’s vote share can easily shift 2 points one way while the other candidate’s share shifts 2 points in the opposite direction. This year, rather than ask a head-to-head question in each race, we asked about the probability of supporting each candidate in the race as separate questions. This gives a proxy for the horse race question while also providing another layer of understanding the campaign’s dynamics – specifically, how high or low is each candidate’s potential ceiling of support.
The weighting modification was a different situation. In the 2020 and 2021 cycles, Monmouth added some predictive interactions to our weighting in an attempt to capture more of the unknowns in different types of voters who could support Donald Trump. Both our 2020 experience and especially our 2021 gubernatorial polling indicated those added layers actually produced movement in the wrong direction. As a result, we pared back our weighting parameters in 2022 to focus on known key demographic information. This simplified matrix appears to have produced better results in 2022 (and when applied retrospectively in 2021, our estimates improved there as well).
On to the big question: how did we do in 2022? Fairly well as it happens. Our Pennsylvania poll – which wrapped up interviewing a week before the election – was spot on in terms of relative candidate support (i.e., the number of voters who definitely/probably would support each candidate). Our Georgia poll – conducted two weeks out – was a little farther off from the eventual result, but accurately showed the Democrat ahead for U.S. Senate and the Republican ahead by a larger margin for governor. On top of that, our poll numbers came even closer to the actual results when voter motivation was taken into account.
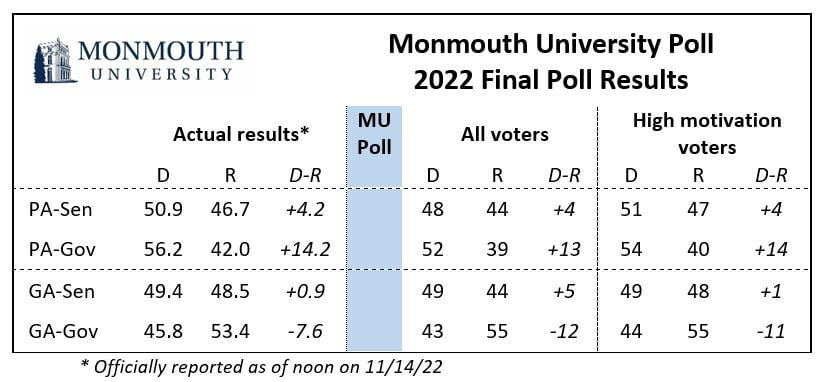
As mentioned previously, Monmouth did not create a typical likely voter model this cycle, but we did provide results for different electorate subsets. Results for the subset of voters who turned out in prior elections (specifically 2020 and 2018) were not much different than the results we found for all voters. However, the results for the subset of high motivation* voters did shift the results in Georgia’s U.S. Senate race in a way that matched the actual result. Another interesting finding in our analysis, is that “motivation” showed a much better correlation with the actual results than our “enthusiasm” metric did in the four races Monmouth polled this cycle. The latter metric pushed voter support a little too Democratic in Pennsylvania and too Republican in Georgia.
One caveat on the motivation metric’s utility is our evidence is limited to four contests in two states. When we retroactively applied it to our 2021 gubernatorial polling it improved the New Jersey estimate to D+3 (in line with the actual result) but worsened the Virginia estimate to R+9 (7 points off the result). It’s certainly not a panacea, but worth exploring further.
Of course, Monmouth’s polling also followed our standard practice of asking about a lot of issues in each of the races we covered. We were likely the first poll that provided actual data countering the unsupported and overblown media narrative that John Fetterman’s debate performance hurt his chances. But we also covered a slew of issues and undercurrents in our polling that did not make it into media coverage. [We actually have a team of students working on a content analysis study of how our polls were covered this fall – more on that in the coming months.]
We are under no misapprehension that we can change the way media covers election polling, but that will not stop us from using our polls to provide a better context for understanding voter dynamics in the electoral contest. Contextualizing the state of these races in a way that stymies the polling aggregators is just an added bonus. On to 2024.
———————————————-
* Shout out to Melissa Bell of Global Strategy Group. In 2019, I moderated a panel at the American Association for Public Opinion Research national conference where Melissa presented some of GSG’s work correlating turnout with their poll questions on motivation and excitement. As a result, I started asking a similar motivation question in 2020 and modified it for this year’s Monmouth polling.