West Long Branch, NJ – The race for House of Representatives in Pennsylvania’s newly drawn 1st congressional district is shaping up to be a close contest, according to the Monmouth University Poll. Republican incumbent Brian Fitzpatrick is well liked and holds a 7 point lead among all potential voters, but Democratic voter enthusiasm suggests that this could be a very tight race with only a one point gap separating him from challenger Scott Wallace among likely voters.
Fitzpatrick holds a 49% to 42% lead over Wallace among all potential voters – that is voters who have participated in an election since 2010 or have newly registered to vote (a group that represents about 80% of all registered voters in the district). White voters without a college degree back Fitzpatrick by a sizable 59% to 33% margin whereas those who hold a college degree prefer Wallace by 50% to 43%. Black, Asian, and Latino voters back Wallace by 51% to 32%.
The race is much tighter using two different likely voter models. A historical midterm model gives Fitzpatrick a negligible 48% to 47% lead, while a model that includes a turnout surge in areas where Pres. Donald Trump is unpopular gives an insignificant edge to Wallace at 48% to 47%.
A key difference between the likely electorate and the larger pool of potential voters is greater Democratic enthusiasm. For example, 69% of Wallace supporters say they have a lot of interest in the Congressional election compared with 56% of Fitzpatrick backers who say the same. However, the range of uncertainty for a typical House poll at this point in the cycle means that either candidate could have a lead of as much as 10 points. Monmouth used similar likely voter models in polling recent special elections, with the “surge” model representing geographical turnout patterns seen in some, but not all, elections over the past year.
“This suburban Philadelphia district is exactly the type of place where Democrats need to do well if they are going to take control of the House. A win in this specific district may not be essential, but Democrats have to be competitive here. Currently, it looks like enthusiasm levels on the left are helping that effort, but just barely,” said Patrick Murray, director of the independent Monmouth University Polling Institute.

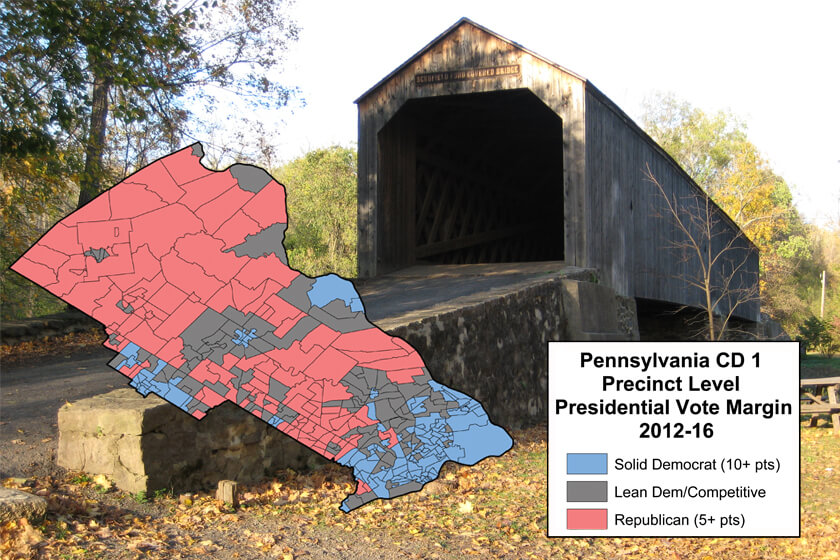
Hillary Clinton won what is now this district by 2 points in the 2016 presidential election. Barack Obama won it by a single point over Mitt Romney in 2012. While the overall presidential margin was similar in the last two elections, there were quite a few precincts – mostly in the central part of the district – where Trump did worse than Romney and others where he did better – including Republican strongholds in the west and Democratic precincts in the east. In precincts where Trump did worse than Romney by at least 3 points, Fitzpatrick has a small 47% to 42% lead over Wallace among all potential voters. In districts where Trump outperformed Romney by at least 3 points, Fitzpatrick has a more sizable lead of 53% to 42%.
Among all potential voters, 53% have a favorable view of Fitzpatrick compared to just 22% who have an unfavorable view, with 25% expressing no opinion. The challenger Wallace is seen favorably by 32% of voters and unfavorably by 15%, with 53% having no opinion. It is worth noting that 21% of Wallace voters actually have a favorable opinion of the Republican incumbent.
“Fitzpatrick would be a shoe-in if he was running in a political vacuum. But he’s not. President Trump changes the entire complexion of this race,” said Murray.
Among all potential voters, 47% approve of the job Trump is doing as president and 49% disapprove, but those who strongly disapprove (43%) clearly outnumber those who strongly approve (31%). Similarly, 44% support the president on most issues and 49% are opposed. Most voters (58%) say it is very important that they cast a vote for Congress that shows how they feel about Trump. The key differentiator is that 67% of those who oppose Trump say it is a very important consideration in their vote compared to a smaller 57% of Trump supporters who say the same.
About 1-in-5 voters (21%) in Pennsylvania’s 1st district say Fitzpatrick has been too supportive of Trump compared with 15% who say he has not been supportive enough. Another 31% say the GOP Congressman has given Trump the right amount of support and 34% are unsure.
Just over half of the electorate (52%) say that Fitzpatrick is in touch with the residents of the district and 26% say he is out of touch. Another 22% have no opinion. Voters are more divided on Wallace, with 32% saying he is in touch and 25% out of touch with 43% having no opinion.
“Republicans have been trying to counter the national trends here by painting Wallace as a carpetbagger. That strategy could work since the Democratic challenger is not well known right now. It is still early in the cycle and a lot could change by November. The only thing we know is that this race may be competitive, but it is not a slam dunk for Democrats by any means,” said Murray.
The Monmouth University Poll was conducted by telephone from May 31 to June 3, 2018 with 451 Pennsylvania voters in Pennsylvania’s 1st Congressional District November general election. The question results in this release have a margin of error of +/- 4.6 percentage points. The error of the gap between the two candidates’ vote share (i.e. the margin of the “lead”) is +/- 6.5 percentage points for the full sample and +/- 8.7 percentage points for the likely voter models. The poll was conducted by the Monmouth University Polling Institute in West Long Branch, NJ.
QUESTIONS AND RESULTS
(* Some columns may not add to 100% due to rounding.)
1/2. If the election for U.S. House of Representatives in your district was today, would you vote for Brian Fitzpatrick the Republican or Scott Wallace the Democrat, or some other candidate?
[IF UNDECIDED: If you had to vote for one of the following at this moment, do you lean more toward Brian Fitzpatrick or more toward Scott Wallace?] [NAMES WERE ROTATED]
| With leaners | June 2018 | ||
| Likely Voter Models | |||
|
Full voter |
Standard |
Democratic | |
| Brian Fitzpatrick | 49% | 48% | 47% |
| Scott Wallace | 42% | 47% | 48% |
| Other | 1% |
<1% |
<1% |
| (VOL) Undecided | 8% | 5% | 5% |
| (n) | (451) | (254) | (254) |
[QUESTIONS 3 & 4 WERE ROTATED]
3. Is your general impression of Brian Fitzpatrick very favorable, somewhat favorable, somewhat unfavorable, or very unfavorable, or do you have no opinion of him?
| June 2018 | |
| Very favorable | 20% |
| Somewhat favorable | 33% |
| Somewhat unfavorable | 13% |
| Very unfavorable | 9% |
| No opinion | 25% |
| (n) | (451) |
4. Is your general impression of Scott Wallace very favorable, somewhat favorable, somewhat unfavorable, or very unfavorable, or do you have no opinion of him?
| June 2018 | |
| Very favorable | 10% |
| Somewhat favorable | 22% |
| Somewhat unfavorable | 7% |
| Very unfavorable | 8% |
| No opinion | 53% |
| (n) | (451) |
5. How much interest do you have in the upcoming election for House of Representatives – a lot of interest, a little interest, or not much interest at all?
| June 2018 | |
| A lot | 53% |
| A little | 30% |
| Not much at all | 17% |
| (VOL) Don’t know | 1% |
| (n) | (451) |
6. Have you been following the campaign in your Congressional district very closely, somewhat closely, or not too closely?
| June 2018 | |
| Very closely | 15% |
| Somewhat closely | 42% |
| Not too closely | 43% |
| (VOL) Don’t know | 0% |
| (n) | (451) |
7. Do you approve or disapprove of the job Donald Trump is doing as president? [Do you (approve/disapprove) strongly or somewhat?]
| June 2018 | |
| Strongly approve | 31% |
| Somewhat approve | 16% |
| Somewhat disapprove | 6% |
| Strongly disapprove | 43% |
| (VOL) Don’t know | 3% |
| (n) | (451) |
8. On most issues would you say you support or oppose what President Trump is doing?
| June 2018 | |
| Support | 44% |
| Oppose | 49% |
| (VOL) Depends/both | 5% |
| (VOL) Don’t know | 3% |
| (n) | (451) |
9. How important is it for you to cast a vote for Congress that shows your [support of/opposition to] President Trump – very important, somewhat important, not too important, or not at all important?
| June 2018 | |
| Very important | 58% |
| Somewhat important | 24% |
| Not too important | 5% |
| Not at all important | 4% |
| (VOL) Don’t know | 9% |
| (n) | (451) |
10. Has Brian Fitzpatrick been too supportive of Donald Trump, not supportive enough, or has he given the right amount of support to Trump?
| June 2018 | |
| Too supportive | 21% |
| Not supportive enough | 15% |
| Right amount of support | 31% |
| (VOL) Don’t know | 34% |
| (n) | (451) |
[QUESTIONS 11 & 12 WERE ROTATED]
11. Do you think Brian Fitzpatrick is in touch or out of touch with the residents of this district?
| June 2018 | |
| In touch | 52% |
| Out of touch | 26% |
| (VOL) Don’t know | 22% |
| (n) | (451) |
12. Do you think Scott Wallace is in touch or out of touch with the residents of this district?
| June 2018 | |
| In touch | 32% |
| Out of touch | 25% |
| (VOL) Don’t know | 43% |
| (n) | (451) |
[QUESTIONS 13 & 14 WERE ROTATED]
13. Is your general impression of the Republican Party very favorable, somewhat favorable, somewhat unfavorable, or very unfavorable, or do you have no opinion?
| June 2018 | |
| Very favorable | 11% |
| Somewhat favorable | 32% |
| Somewhat unfavorable | 18% |
| Very unfavorable | 29% |
| No opinion | 10% |
| (n) | (451) |
14. Is your general impression of the Democratic Party very favorable, somewhat favorable, somewhat unfavorable, or very unfavorable, or do you have no opinion?
| June 2018 | |
| Very favorable | 12% |
| Somewhat favorable | 32% |
| Somewhat unfavorable | 17% |
| Very unfavorable | 27% |
| No opinion | 12% |
| (n) | (451) |
15. Would you rather see the Republicans or the Democrats in control of Congress, or doesn’t this matter to you?
| June 2018 | |
| Republicans | 39% |
| Democrats | 41% |
| Does not matter | 19% |
| (VOL) Don’t know | 2% |
| (n) | (451) |
METHODOLOGY
The Monmouth University Poll was sponsored and conducted by the Monmouth University Polling Institute from May 31 to June 3, 2018 with a random sample of 451 potential voters in Pennsylvania’s 1st Congressional District, drawn from a list of registered voters who voted in at least one of the last four general elections or have registered to vote since January 2016. This includes 270 contacted by a live interviewer on a landline telephone and 181 contacted by a live interviewer on a cell phone. Monmouth is responsible for all aspects of the survey design, data weighting and analysis. Final sample is weighted for region, party registration, age, gender, education and race based on state voter registration list and U.S. Census information. Data collection support provided by Braun Research (field) and L2 (voter sample). For results based on this sample, one can say with 95% confidence that the error attributable to sampling has a maximum margin of plus or minus 4.6 percentage points (unadjusted for sample design). Sampling error can be larger for sub-groups (see table below). In addition to sampling error, one should bear in mind that question wording and practical difficulties in conducting surveys can introduce error or bias into the findings of opinion polls.
| DEMOGRAPHICS (weighted) |
| Party Registration |
| 43% Republican |
| 44% Democrat |
| 14% Neither |
| Self-Reported Party ID |
| 33% Republican |
| 32% Independent |
| 35% Democrat |
| 49% Male |
| 51% Female |
| 17% 18-34 |
| 22% 35-49 |
| 34% 50-64 |
| 27% 65+ |
| 86% White, non-Hispanic |
| 14% Other |
| 58% No college degree |
| 42% 4-year college degree |
| 90% Bucks County |
| 10% Montgomery County |
Click on pdf file link below for full methodology and results by key demographic groups.