
West Long Branch, NJ – Hillary Clinton has a 4 point lead over Donald Trump among voters likely to cast ballots in November. While this is down from a 7 point lead last month, Clinton continues to have an advantage on the question of presidential temperament. The latest Monmouth University Poll also finds that 3-in-4 voters plan to watch tonight’s debate, but very few actually expect to learn anything that will impact their choice of candidate. A majority also feel that third party candidates should have been included in the debate and that debate moderators should fact check the candidates.
Currently, 46% of likely voters support Clinton and 42% back Trump, with 8% supporting Libertarian Gary Johnson, and 2% backing Jill Stein of the Green Party. Support among all registered voters stands at 45% Clinton, 40% Trump, 8% Johnson, and 3% Stein. In late August, Clinton’s likely voter support was the same at 46% while Trump’s support was lower at 39%. Third party support is basically unchanged.
Clinton has the support of 91% of Democrats while Trump gets the backing of 85% of Republicans. This result is in line with Clinton’s partisan support over the summer, but represents an improvement for Trump, whose GOP support was below 80% in prior polls. Independents prefer Trump over Clinton by 39% to 33%. In late August, Clinton had a 5 point advantage among independents while earlier last month Trump held a slim 2 point edge.
Clinton leads among millennial voters under 35 years old by 48% to 28%, although a sizable number give their support to Johnson (13%) and Stein (4%). Voters who are 35 to 54 years old split their support at 42% for Trump and 41% for Clinton. Voters age 55 and older are also divided at 47% for Clinton and 46% for Trump. Clinton had a clear edge among all these age groups last month.
“Clinton’s support has softened since the summer, but she has still managed to grab a share of those who tend to vote Republican,” said Patrick Murray, director of the independent Monmouth University Polling Institute.
Both major party candidates continue to have high negative ratings, although Trump’s standing has improved slightly. Currently, 36% of voters have a favorable opinion of Clinton and 54% have an unfavorable view of her, compared with a 34% to 51% rating last month. Likewise, 32% of voters have a favorable opinion of Trump and 57% have an unfavorable view of him, compared with a 26% to 57% rating last month.
Clinton has a slight edge on the “lesser of two evils” metric. Nearly half of voters (47%) say it is very important to them to make sure Trump does not get elected. Somewhat fewer voters (41%) feel the same about Clinton. When the responses to these two questions are combined, 13% of voters say it is at least somewhat important to keep both Clinton and Trump out of the White House, 44% say it is important to stop Trump, 36% say it is important to stop Clinton, and 7% say they don’t feel it is important to stop either candidate from being elected. Among voters who are currently supporting a third party candidate or are undecided, 43% say it is important to keep both major party nominees from being elected, 18% say it is important only to stop Trump and 17% say it is important only to stop Clinton, while 22% say stopping either candidate is not important to them.
Clinton has an advantage over Trump on presidential temperament although there is no edge when voters are asked about actual issue areas. Just under 6-in-10 voters (58%) say Clinton has the right temperament to be president, including 47% of undecided voters and third party supporters. Only one-third (35%) feel that Trump has a presidential temperament, including just 15% of undecided voters and third party supporters.
Voters are divided on who would better handle two key issue areas. On the economy and jobs, 48% prefer Trump and 48% prefer Clinton. On dealing with the threat of terrorism on U.S. soil, 48% prefer Clinton and 45% prefer Trump. Trump has an advantage on these two issues, though, among voters who are undecided or supporting a third party candidate – 44% to 32% over Clinton on the economy and 43% to 26% over Clinton on terrorism.
“If persuadable voters’ final calculation comes down to temperament, Clinton should pick up a few points. If it comes down to issues, Trump may see a bump,” said Murray.
The First Debate
Three-in-four voters (75%) plan to watch the first debate. However, they are more likely to be those who already back Clinton (81%) or Trump (79%) rather than undecided voters or those supporting a third party candidate (48%).
Despite the anticipated interest, very few voters expect that the debate’s outcome will have an impact on their ultimate candidate choice. Just 2% say it is very likely that the debate will cause them to change their mind or help them decide on their vote choice. Another 10% say the debate is somewhat likely to have an impact. Fully 87% do not see any possibility where the debate will actually have an impact on their vote choice. Those who anticipate the possibility of changing their vote because of the debate include just 8% of Clinton supporters, 12% of Trump supporters and only 25% of those who are undecided or supporting a third party candidate.
“Pundits expect that a lot will be riding on the first debate. The voters? Not so much,” said Murray.
There has been a bit of controversy over whether third party candidates should be included in the presidential debates and what the role of the moderators should be. A majority of voters (55%) believe that either Gary Johnson or Jill Stein should have been allowed on the debate stage tonight, with the vast majority of this group saying that both candidates should have been included. Just 39% of voters agree with the debate commission’s decision to limit participation to the two major party nominees.
Most voters (60%) believe one of the duties of the moderators is to fact check candidates who state false information during the debates. Only 31% say the moderators should leave it to the candidates to point out any false statements by their opponent. Trump supporters (46%) are less likely than either Clinton backers (69%) or third party supporters and undecided voters (69%) to say that the debate moderators should fact check the candidates.
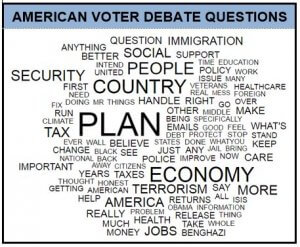
The Monmouth University Poll also asked voters what debate question they would ask the two nominees if they had the opportunity. In general, voters want to hear specific proposals from the candidates, such as the Republican voter from North Carolina who asks, “What would be your plan to bring jobs back to the United States; a detailed plan?” The main topics voters want to hear about are the economy, terrorism and national security, taxes, immigration, and social security.
Given the overwhelmingly negative outlook for this election, perhaps the most telling question came from the Rhode Island independent voter, who simply asks, “Why?”
The Monmouth University Poll was conducted by telephone from September 22 to 25, 2016 with 802 registered voters in the United States. The results in this release have a margin of error of ± 3.5 percent. The poll was conducted by the Monmouth University Polling Institute in West Long Branch, NJ.
QUESTIONS AND RESULTS
(* Some columns may not add to 100% due to rounding.)
1/2. If the election for President was today, would you vote for Donald Trump the Republican, Hillary Clinton the Democrat, Gary Johnson the Libertarian, or Jill Stein of the Green Party? [IF UNDECIDED: If you had to vote for one of the following candidates at this moment, who do you lean toward – Donald Trump or Hillary Clinton?] [NAMES WERE ROTATED]
| TREND: Registered voters (with leaners) | Sept. 2016 | Late Aug. 2016 | Early Aug. 2016 | July 2016 | June 2016 | March 2016 |
| Donald Trump | 40% | 36% | 34% | 40% | 36% | 34% |
| Hillary Clinton | 45% | 43% | 46% | 43% | 42% | 42% |
| Gary Johnson | 8% | 8% | 7% | 5% | 9% | 11% |
| Jill Stein | 3% | 2% | 2% | 2% | 4% | n/a |
| (VOL) Other candidate | 1% | 1% | <1% | 2% | 2% | 1% |
| (VOL) Undecided | 3% | 7% | 6% | 6% | 4% | 5% |
| (VOL) No one | 0% | 4% | 4% | 4% | 1% | 7% |
| (n) | (802) | (802) | (803) | (805) | (803) | (848) |
| TREND: Likely voters (with leaners) | Sept. 2016 | Late Aug. 2016 | Early Aug. 2016 | July 2016 | June 2016 | March 2016 |
| Donald Trump | 42% | 39% | 37% | 43% | 37% | n/a |
| Hillary Clinton | 46% | 46% | 50% | 45% | 44% | n/a |
| Gary Johnson | 8% | 7% | 7% | 5% | 9% | n/a |
| Jill Stein | 2% | 2% | 2% | 1% | 4% | n/a |
| (VOL) Other candidate | 1% | 1% |
<1% | 2% | 1% | n/a |
| (VOL) Undecided | 2% | 5% | 3% | 4% | 3% | n/a |
| (VOL) No one | 0% | 0% | 0% | 0% | 1% | n/a |
| (n) | (729) | (689) | (683) | (688) | (721) | n/a |
HEAD TO HEAD – TRUMP v. CLINTON [Johnson/Stein/Other supporters reassigned to major party nominee they lean toward]:
| TREND: Registered voters | Sept. 2016 | Late Aug. 2016 | Early Aug. 2016 | July 2016 | June 2016 | March 2016 |
| Donald Trump | 43% | 38% | 36% | 41% | 40% | 38% |
| Hillary Clinton | 49% | 47% | 50% | 44% | 47% | 48% |
| (VOL) Other candidate | 5% | 4% | 4% | 5% | 5% | 2% |
| (VOL) Undecided | 3% | 7% | 6% | 6% | 6% | 3% |
| (VOL) No one | 0% | 4% | 4% | 4% | 2% | 9% |
| (n) | (802) | (802) | (803) | (805) | (803) | (848) |
| TREND: Likely voters | Sept. 2016 | Late Aug. 2016 | Early Aug. 2016 | July 2016 | June 2016 | March 2016 |
| Donald Trump | 46% | 42% | 40% | 45% | 41% | n/a |
| Hillary Clinton | 49% | 49% | 54% | 46% | 49% | n/a |
| (VOL) Other candidate | 4% | 4% | 3% | 4% | 5% | n/a |
| (VOL) Undecided | 2% | 5% | 3% | 4% | 5% | n/a |
| (VOL) No one | 0% | 0% | 0% | 0% | 1% | n/a |
| (n) | (729) | (689) | (683) | (688) | (721) | n/a |
[QUESTIONS 3 & 4 WERE ROTATED]
3. Is your general impression of Donald Trump favorable or unfavorable, or do you have no opinion of him?
| TREND: Registered voters | Sept. 2016 | Late Aug. 2016 | Early Aug. 2016 | July 2016 | June 2016 | March 2016 | Oct. 2015 | Aug. 2015 | June 2015 |
| Favorable | 32% | 26% | 26% | 31% | 28% | 30% | 32% | 31% | 18% |
| Unfavorable | 57% | 57% | 61% | 53% | 57% | 60% | 50% | 54% | 57% |
| No opinion | 12% | 17% | 14% | 16% | 15% | 11% | 18% | 14% | 25% |
| (n) | (802) | (802) | (803) | (805) | (803) | (848) | (836) | (1,033) | (829) |
4. Is your general impression of Hillary Clinton favorable or unfavorable, or do you have no opinion of her?
| TREND: Registered voters | Sept. 2016 | Late Aug. 2016 | Early Aug. 2016 | July 2016 | June 2016 | March 2016 | Oct. 2015 | Aug. 2015 | June 2015 |
| Favorable | 36% | 34% | 37% | 34% | 36% | 40% | 41% | 38% | 41% |
| Unfavorable | 54% | 51% | 49% | 52% | 52% | 51% | 48% | 48% | 44% |
| No opinion | 10% | 15% | 14% | 14% | 13% | 9% | 11% | 14% | 14% |
| (n) | (802) | (802) | (803) | (805) | (803) | (848) | (836) | (1,033) | (829) |
Regardless of who you may support for president…
[QUESTIONS 5 & 6 WERE ROTATED]
5. How important is it to you to make sure that Donald Trump does NOT get elected president – very important, somewhat important, not too important, or not at all important?
| TREND: Registered voters | Sept. 2016 | June 2016 |
| Very important | 47% | 49% |
| Somewhat important | 9% | 10% |
| Not too important | 7% | 8% |
| Not at all important | 34% | 31% |
| (VOL) Don’t know | 3% | 2% |
| (n) | (802) | (803) |
6. How important is it to you to make sure that Hillary Clinton does NOT get elected president – very important, somewhat important, not too important, or not at all important?
| TREND: Registered voters | Sept. 2016 | June 2016 |
| Very important | 41% | 41% |
| Somewhat important | 8% | 10% |
| Not too important | 8% | 11% |
| Not at all important | 40% | 35% |
| (VOL) Don’t know | 3% | 3% |
| (n) | (802) | (803) |
[QUESTIONS 7 & 8 WERE ROTATED]
7. Regardless of whether you would vote for him, do you think Donald Trump does or does not have the right temperament to be president?
| TREND: Registered voters | Sept. 2016 | Early Aug. 2016 | July 2016 | March 2016 |
| Does | 35% | 27% | 32% | 27% |
| Does not | 61% | 67% | 61% | 68% |
| (VOL) Don’t know | 4% | 5% | 6% | 5% |
| (n) | (802) | (803) | (805) | (848) |
8. Regardless of whether you would vote for her, do you think Hillary Clinton does or does not have the right temperament to be president?
| TREND: Registered voters | Sept. 2016 | Early Aug. 2016 | July 2016 | March 2016 |
| Does | 58% | 61% | 52% | 54% |
| Does not | 39% | 34% | 42% | 42% |
| (VOL) Don’t know | 4% | 5% | 5% | 4% |
| (n) | (802) | (803) | (805) | (848) |
[QUESTIONS 9 & 10 WERE ROTATED]
9. Who do you trust more to handle the economy and jobs – Donald Trump or Hillary Clinton? [NAMES WERE ROTATED]
| TREND: Registered voters | Sept. 2016 | June 2016 |
| Trump | 48% | 44% |
| Clinton | 48% | 47% |
| (VOL) Neither | 4% | 6% |
| (VOL) Don’t know | 0% | 3% |
| (n) | (802) | (803) |
10. Who do you trust more to handle the threat of terrorism on U.S. soil – Donald Trump or Hillary Clinton? [NAMES WERE ROTATED]
| TREND: Registered voters | Sept. 2016 | June 2016 |
| Trump | 45% | 44% |
| Clinton | 48% | 46% |
| (VOL) Neither | 6% | 7% |
| (VOL) Don’t know | 2% | 3% |
| (n) | (802) | (803) |
11. As you may know the first presidential debate between Trump and Clinton will be held Monday night. Do you plan to watch the debate live or not?
| Registered voters | Sept. 2016 |
| Yes | 75% |
| No | 18% |
| (VOL) May watch clips later | 3% |
| (VOL) Don’t know | 3% |
| (n) | (802) |
12. [IF VOTE CHOICE IS DECIDED] How likely is it that the debate will change your mind about which candidate you intend to support – very likely, somewhat likely, or not likely? [IF VOTE CHOICE IS UNDECIDED] How likely is it that the debate will help you make up your mind about which candidate to support – very likely, somewhat likely, or not likely?
| Registered voters | Sept. 2016 |
| Very likely | 2% |
| Somewhat likely | 10% |
| Not likely | 87% |
| (VOL) Don’t know | 1% |
| (n) | (802) |
13. Should the debate include third party candidates Gary Johnson or Jill Stein, or should it be only the two major party nominees on stage? [If INCLUDE: Should the debate have included Johnson or Stein, or both of them?]
| Registered voters | Sept. 2016 |
| Johnson only | 6% |
| Stein only | 0% |
| Both of them | 49% |
| (VOL) Depends | 1% |
| Only major party nominees | 39% |
| (VOL) Don’t know | 5% |
| (n) | (802) |
14. Should the debate moderators fact check a candidate who states false information during the debate, or should they leave it to the candidates to point out any false information stated by their opponent?
| Registered voters | Sept. 2016 |
| Should fact check | 60% |
| Leave to candidates | 31% |
| (VOL) Both | 4% |
| (VOL) Don’t know | 5% |
| (n) | (802) |
15. If you could ask one short question of the presidential candidates at the debate, what would it be? [VERBATIM ANSWERS WERE RECORDED]
[Q16-27 held for future release]
METHODOLOGY
The Monmouth University Poll was sponsored and conducted by the Monmouth University Polling Institute from September 22 to 25, 2016 with a national random sample of 802 registered voters. Interviews were conducted by a live caller in English, including 402 drawn from a list of registered voters (201 landline / 201 cell phone) and 400 using random digit dial (200 landline / 200 cell phone). Monmouth is responsible for all aspects of the survey design, data weighting and analysis. The final sample is weighted for age, gender, race and partisanship based on voter list and U.S. Census information. Data collection support provided by Braun Research (field), Aristotle (voter list sample), and SSI (RDD sample). For results based on this sample, one can say with 95% confidence that the error attributable to sampling has a maximum margin of plus or minus 3.5 percentage points (unadjusted for sample design). Sampling error can be larger for sub-groups (see table below). In addition to sampling error, one should bear in mind that question wording and practical difficulties in conducting surveys can introduce error or bias into the findings of opinion polls.
| DEMOGRAPHICS (weighted) |
| Self-Reported |
| 28% Republican |
| 39% Independent |
| 34% Democrat |
| 47% Male |
| 53% Female |
| 25% 18-34 |
| 25% 35-49 |
| 28% 50-64 |
| 22% 65+ |
| 71% White |
| 13% Black |
| 11% Hispanic |
| 5% Asian/Other |
Click on pdf file link below for full methodology and results by key demographic groups.


