West Long Branch, NJ – Democrat Abigail Spanberger holds a narrow lead over incumbent Republican Dave Brat in the race for Virginia’s 7th Congressional District, according to the Monmouth University Poll. Voter opinion of Spanberger is somewhat more positive than it is of Brat, who came to office as a Tea Party candidate and is considered one of the most ideologically conservative members of Congress. Spanberger does well in the suburban part of the district that tilted more Democratic in the 2016 presidential election, while Brat performs strongly in the rural part of the district that actually voted even more Republican in 2016 than it did four years earlier.
Spanberger is supported by 47% and Brat is supported by 42% of all potential voters – that is voters who have participated in at least one election since 2010 or have newly registered to vote (a group that represents about 90% of all registered voters in the district). Another 2% of voters support Libertarian Joe Walton and 9% are undecided. The Democrat’s lead narrows when applying two different likely voter models. A historical midterm model shows a tie at 47% for Spanberger and 47% for Brat. A model that projects a possible turnout surge in Democratic precincts gives Spanberger a slight lead of 48% to 45%. The margin of the lead in these voter models is not statistically significant.
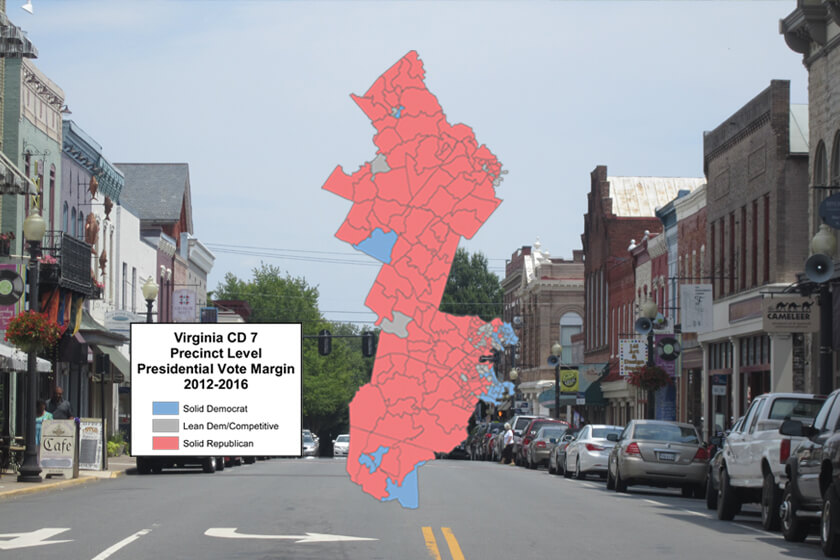
Spanberger holds a sizable advantage in the Richmond suburbs of Henrico County (58% to 30% for Brat) and Chesterfield County (50% to 35%) – areas that supported Hillary Clinton for president in 2016 after voting for Mitt Romney in 2012. Brat holds a 57% to 35% lead over Spanberger in the remaining part of the district. This area, which runs from Culpeper to Nottoway County, actually gave Donald Trump a bigger margin of support in 2016 than it did for Romney four years earlier. Overall, voters in Virginia’s 7th district supported Romney for president by 11 points in 2012 and Trump by just over 6 points in 2016. Brat won re-election to his House seat by 15 points two years ago.
“This is a tale of two districts. The Richmond suburbs that backed Clinton in 2016 support Spanberger while the Trump strongholds are firmly behind Brat. The reason this race is so close right now is because there are more voters in the suburban areas,” said Murray.
Brat holds a very large lead over Spanberger among white voters without a college degree (61% to 31%). This is offset by Spanberger’s advantage among college educated white voters (52% to 42%) and non-white voters regardless of education (68% to 9%). Just over half of all voters (56%) have a lot of interest in the election, which includes 63% of Spanberger supporters and 62% of Brat supporters.
The district is currently divided on which party they want in charge of Congress, with 39% of VA-07 voters saying they prefer to see GOP control and 37% saying they want the Democrats to take over. Another 20% say that party control of Congress does not matter to them. Spanberger does better than Brat in winning over partisan converts. The poll finds that 83% of self-identified Republicans support Brat, but 13% say they will cross party lines to vote for Spanberger. The Democratic candidate, on the other hand, holds onto 91% of her fellow partisans while losing none to Brat. Independent voters are divided at 45% for Spanberger and 36% for Brat.
“Some Republican voters who are lukewarm on Brat feel comfortable enough with Spanberger to give her their support, at least for now,” said Murray.
Spanberger, a former CIA officer, gets a positive rating of 43% favorable and 19% unfavorable from VA-07 voters, with 39% having no opinion. Views of Brat are more mixed at 35% favorable and 27% unfavorable, with 37% having no opinion. The incumbent entered Congress after upsetting former House Majority Leader Eric Cantor in the 2014 Republican primary.
Overall, 47% of VA-07 voters approve of the job Trump is doing as president while a similar 46% disapprove, although those who strongly disapprove (40%) slightly outnumber those who strongly approve (33%). The poll finds that 61% of potential voters say it is very important for them to cast a vote for Congress that shows how they feel about the president – with Trump opponents (70%) being somewhat more likely than Trump supporters (64%) to feel this way.
Currently, 27% of voters say Brat has been too supportive of the president, while 39% say he has offered the right amount of support and 8% say he has not been supportive enough. Another 26% have no opinion. As a point of comparison, a similar number of voters (25%) worry that Spanberger will be too supportive of House Minority Leader Nancy Pelosi if she is elected to Congress, while 40% say she will offer the right amount of support and 9% say she will offer too little support. Another 26% have no opinion.
When asked to choose the top issue in their vote for Congress from a list of six policy areas, 30% of VA-07 voters pick health care. This is followed by immigration (17%), gun control (13%), tax policy (13%), job creation (12%), and abortion (7%). Voters are divided on whether they approve (42%) or disapprove (39%) of the tax reform plan passed by Congress last year.
Spanberger has a slight advantage on handling voters’ top concern of health care, with 37% saying they trust the Democrat more to keep health care affordable compared to 32% who say they trust Brat more on this issue. Another 18% say they trust both candidates equally. On handling the issue of illegal immigration, 36% say they trust Brat more, 34% say they trust Spanberger more, and 18% say they trust both candidates equally.
The Monmouth University Poll was conducted by telephone from September 15 to 24, 2018 with 400 potential voters in Virginia’s 7th Congressional District. The question results in this release have a margin of error of +/- 4.9 percentage points for the full sample and +/-5.4 percentage points for the likely voter models. The error of the gap between the two candidates’ vote share (i.e. the margin of the “lead”) is +/-6.9 percentage points for the full sample and +/- 7.6 percentage points for the likely voter models. The poll was conducted by the Monmouth University Polling Institute in West Long Branch, NJ.
QUESTIONS AND RESULTS
(* Some columns may not add to 100% due to rounding.)
1/2. If the election for U.S. House of Representatives in your district was today, would you vote for Dave Brat the Republican, Abigail Spanberger the Democrat, or Joe Walton the Libertarian? [IF UNDECIDED: If you had to vote for one of the following at this moment, do you lean more toward Dave Brat or more toward Abigail Spanberger?] [NAMES WERE ROTATED]
| With leaners | September 2018 | ||
| Likely Voter Models | |||
| Full voter sample | Standard Midterm | Democratic “Surge” | |
| Dave Brat | 42% | 47% | 45% |
| Abigail Spanberger | 47% | 47% | 48% |
| Joe Walton | 2% | <1% | 1% |
| (VOL) Undecided | 9% | 6% | 7% |
| (n) | (400) | (329) | (329) |
[QUESTIONS 3 & 4 WERE ROTATED]
3. Is your general impression of Dave Brat favorable or unfavorable, or do you have no opinion of him?
| Sept. 2018 | |
| Favorable | 35% |
| Unfavorable | 27% |
| No opinion | 37% |
| (n) | (400) |
4. Is your general impression of Abigail Spanberger favorable or unfavorable, or do you have no opinion of her?
| Sept. 2018 | |
| Favorable | 43% |
| Unfavorable | 19% |
| No opinion | 39% |
| (n) | (400) |
5. How much interest do you have in the upcoming election for House of Representatives – a lot of interest, a little interest, or not much interest at all?
| Sept. 2018 | |
| A lot | 56% |
| A little | 32% |
| Not much at all | 11% |
| (VOL) Don’t Know | 1% |
| (n) | (400) |
6. Have you been following the campaign in your congressional district very closely, somewhat closely, or not too closely?
| Sept. 2018 | |
| Very closely | 25% |
| Somewhat closely | 42% |
| Not too closely | 32% |
| (VOL) Don’t Know | 0% |
| (n) | (400) |
7. Do you approve or disapprove of the job Donald Trump is doing as president? [Do you (approve/disapprove) strongly or somewhat?]
| Sept. 2018 | |
| Strongly approve | 33% |
| Somewhat approve | 14% |
| Somewhat disapprove | 6% |
| Strongly disapprove | 40% |
| (VOL) Don’t know | 7% |
| (n) | (400) |
8. On most issues would you say you support or oppose what President Trump is doing?
| Sept. 2018 | |
| Support | 46% |
| Oppose | 46% |
| (VOL) Depends/both | 5% |
| (VOL) Don’t know | 3% |
| (n) | (400) |
9. How important is it for you to cast a vote for Congress that shows your [support of/opposition to] President Trump – very important, somewhat important, not too important, or not at all important?
| Sept. 2018 | |
| Very important | 61% |
| Somewhat important | 17% |
| Not too important | 6% |
| Not at all important | 5% |
| (VOL) Don’t know | 10% |
| (n) | (400) |
10. Would you rather see the Republicans or the Democrats in control of Congress, or doesn’t this matter to you?
| Sept. 2018 | |
| Republicans | 39% |
| Democrats | 37% |
| Does not matter | 20% |
| (VOL) Don’t know | 3% |
| (n) | (400) |
[QUESTIONS 11 & 12 WERE ROTATED]
11. Has Dave Brat been too supportive of Donald Trump, not supportive enough, or has he given the right amount of support to Trump?
| Sept. 2018 | |
| Too supportive | 27% |
| Not supportive enough | 8% |
| Right amount of support | 39% |
| (VOL) Don’t know | 26% |
| (n) | (400) |
12. If Abigail Spanberger is elected do you think she will be too supportive of Nancy Pelosi, not supportive enough, or will she offer the right amount of support to Pelosi?
| Sept. 2018 | |
| Too supportive | 25% |
| Not supportive enough | 9% |
| Right amount of support | 40% |
| (VOL) Don’t know | 26% |
| (n) | (400) |
13. Please tell me which one of the following policy issues is most important to you in your vote choice for Congress? [ITEMS WERE ROTATED]
| Sept. 2018 | |
| Immigration policy | 17% |
| Health care policy | 30% |
| Gun control policy | 13% |
| Abortion policy | 7% |
| Tax policy | 13% |
| Job creation policy | 12% |
| (VOL) Other | 4% |
| (VOL) Don’t know | 4% |
| (n) | (400) |
14. Do you approve or disapprove of the tax reform plan passed by Congress in December? [Do you (approve/disapprove) strongly or somewhat?]
| Sept. 2018 | |
| Strongly approve | 25% |
| Somewhat approve | 17% |
| Somewhat disapprove | 18% |
| Strongly disapprove | 21% |
| (VOL) Don’t know | 20% |
| (n) | (400) |
[QUESTIONS 15 & 16 WERE ROTATED]
15. Who do you trust more to work to keep health care affordable – Dave Brat or Abigail Spanberger, or do you trust both equally? [NAMES WERE ROTATED]
| Sept. 2018 | |
| Dave Brat | 32% |
| Abigail Spanberger | 37% |
| Both equally | 18% |
| (VOL) Neither one | 5% |
| (VOL) Don’t know | 8% |
| (n) | (400) |
16. Who do you trust more to handle the issue of illegal immigration – Dave Brat or Abigail Spanberger, or do you trust both equally? [NAMES WERE ROTATED]
| Sept. 2018 | |
| Dave Brat | 36% |
| Abigail Spanberger | 34% |
| Both equally | 18% |
| (VOL) Neither one | 3% |
| (VOL) Don’t know | 9% |
| (n) | (400) |
17. How important is it for you personally to get involved in politics – very important, somewhat important, not too important, or not at all important?
| Sept. 2018 | |
| Very important | 39% |
| Somewhat important | 35% |
| Not too important | 15% |
| Not at all important | 10% |
| (VOL) Don’t know | 1% |
| (n) | (400) |
METHODOLOGY
The Monmouth University Poll was sponsored and conducted by the Monmouth University Polling Institute from September 15 to 24, 2018 with a random sample of 400 potential voters in Virginia’s 7th Congressional District, drawn from a list of registered voters who voted in at least one of the last four general or primary elections or have registered to vote since January 2016. This includes 180 contacted by a live interviewer on a landline telephone and 220 contacted by a live interviewer on a cell phone in English. Monmouth is responsible for all aspects of the survey design, data weighting and analysis. Final sample is weighted for region, party primary voting history, age, gender, education and race based on state voter registration list and U.S. Census information. Data collection support provided by IHR Research Group (field) and STS/Aristotle (voter sample). For results based on this sample, one can say with 95% confidence that the error attributable to sampling has a maximum margin of plus or minus 4.9 percentage points (unadjusted for sample design). Sampling error can be larger for sub-groups (see table below). In addition to sampling error, one should bear in mind that question wording and practical difficulties in conducting surveys can introduce error or bias into the findings of opinion polls.
| DEMOGRAPHICS (weighted) |
| Party primary history |
| 51% Republican |
| 27% Democrat |
| 22% Neither |
| Self-Reported Party ID |
| 36% Republican |
| 34% Independent |
| 29% Democrat |
| 46% Male |
| 54% Female |
| 19% 18-34 |
| 24% 35-49 |
| 30% 50-64 |
| 26% 65+ |
| 76% White, non-Hispanic |
| 17% Black |
| 7% Hispanic, Asian, other |
| 56% No college degree |
| 44% 4-year college degree |
| 32% Chesterfield County |
| 31% Henrico County |
| 37% Other counties |
Click on pdf file link below for full methodology and results by key demographic groups.