West Long Branch, NJ – Nine in ten Americans celebrate Christmas, although far fewer actually attend religious services to mark the event. Americans find the holiday season to be enjoyable more often than not, but nearly half are making cuts to their shopping lists this year due to inflation. The Monmouth (“Mon-muth”) University Poll also asked about the nation’s favorite holiday songs and carols and received a wide range of selections.
While 9 in 10 Americans (89%) celebrate Christmas, less than half that number (42%) usually attend church for a Christmas service. A majority of those aged 55 and older (56%) attend Christmas services compared with 4 in 10 parents under age 55 (40%) and 3 in 10 adults under age 55 who do not have children (31%). Seven years ago, 50% of Americans said they went to church on Christmas Eve or Christmas Day. The poll also finds that “Merry Christmas” is America’s most common holiday greeting, although the number who say it (61%) is down slightly from five years ago (67%). Three in 10 Americans (30%) usually say “Happy Holidays.”
Overall, 41% of Americans find the holiday season to be more enjoyable than the rest of the year while 30% say it is more stressful. Another 27% say the holidays are no different than the rest of the year. These results have been fairly consistent over the past seven years, although “more enjoyable” dipped to 36% last year. Holiday enjoyment correlates with income level, with 3 in 10 who make less than $50,000 a year saying the holiday season is more enjoyable than the rest of the year, compared with nearly half of those who earn more feeling this way.
One-third of the public (33%) enjoys shopping for holiday gifts a great deal or a fair amount while a similar number (36%) do not enjoy this task much or at all. Interestingly, those who earn over $100,000 (45%) are more likely than those who earn less than $50,000 (33%) to say they do not enjoy holiday shopping. Just under half of American adults (46%) report cutting back on their holiday shopping list this year because of high prices, which is a slightly greater number than said the same in 2021 (40%). Those earning less than $50,000 (48%) are only slightly more likely than those earning more than $100,000 (42%) to report cutting back.
“It seems that having enough money to enjoy the holidays doesn’t necessarily mean you also enjoy spending it. Maybe this is because gift-giving expectations are greater among those in higher income levels,” said Patrick Murray, director of the independent Monmouth University Polling Institute.
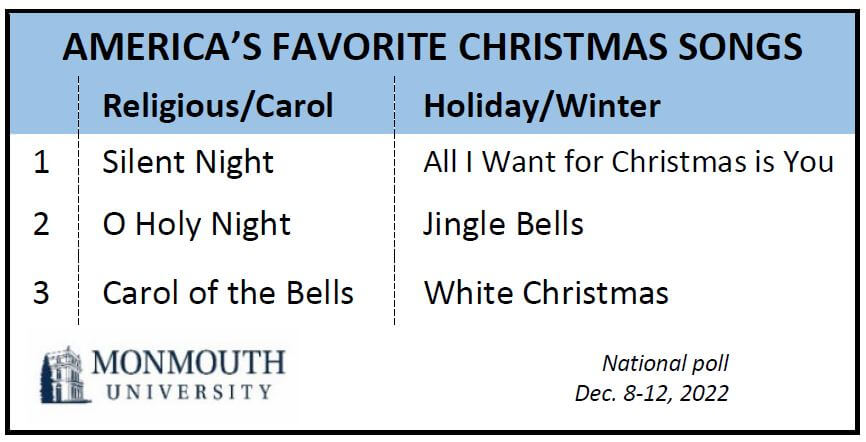
The poll also asked about the top tunes Americans listen to during the season and finds that just over 4 in 10 can name a favorite Christmas carol or holiday song. In the religious or traditional carol category, Silent Night is the clear leader, with O Holy Night taking the second spot. Carol of the Bells, O Come All Ye Faithful, Joy to the World, Little Drummer Boy, and Mary Did You Know are among the nation’s top 15 traditional carols.
There is less clarity in the nonreligious winter or holiday song category, with nearly two dozen tunes making the list. Of these, All I Want for Christmas, Jingle Bells, and White Christmas take the top spots. Interestingly, All I Want for Christmas is the favorite among those under 55 years old, but White Christmas is the top pick for Americans aged 55 and up. Jingle Bells is the second place finisher in both age groups. Other songs that make the list of holiday favorites include The Christmas Song, Rudolph the Red Nosed Reindeer, Winter Wonderland, Last Christmas, and Grandma Got Run Over By a Reindeer.
The Monmouth University Poll was conducted by telephone from December 8 to 12, 2022 with 805 adults in the United States. The question results in this release have a margin of error of +/- 5.0 percentage points for the full sample. The poll was conducted by the Monmouth University Polling Institute in West Long Branch, NJ.
QUESTIONS AND RESULTS
(* Some columns may not add to 100% due to rounding.)
[Q1-11 previously released.]
12.Do you celebrate Christmas, Hanukkah, Kwanzaa, or none of these holidays? [If YES:Which?] [Note: Results add to more than 100% because multiple responses were accepted.]
| TREND: | Dec. 2022 | Dec. 2021 | Nov. 2018 | Dec. 2017 | Dec. 2015 |
| Christmas | 89% | 91% | 90% | 89% | 94% |
| Hanukkah | 7% | 7% | 6% | 5% | 6% |
| Kwanzaa | 3% | 5% | 4% | 3% | 3% |
| None of these | 8% | 7% | 7% | 8% | 4% |
| (VOL) Don’t know | 0% | 1% | 1% | 1% | 1% |
| (n) | (805) | (808) | (802) | (806) | (1,006) |
13.Which holiday greeting do you usually use at this time of year: Merry Christmas, Happy Holidays, Happy Hanukkah, Happy Kwanza, or no holiday greeting at all?
| TREND: | Dec. 2022 | Dec. 2017 |
| Merry Christmas | 61% | 67% |
| Happy Holidays | 30% | 25% |
| Happy Hanukkah | 1% | <1% |
| Happy Kwanzaa | 0% | <1% |
| No holiday greeting at all | 6% | 4% |
| (VOL) Other/depends | 2% | 3% |
| (VOL) Don’t know | 0% | 1% |
| (n) | (805) | (806) |
14.Do you usually attend church on Christmas Eve or Christmas Day, or don’t you usually attend church as part of Christmas?
| TREND: | Dec. 2022 | Dec. 2015 |
| Christmas Eve | 20% | 24% |
| Christmas Day | 11% | 10% |
| (VOL) Depends/Both | 11% | 16% |
| Don’t usually attend church | 46% | 43% |
| (VOL) Don’t know | 1% | 1% |
| Do not celebrate Christmas | 11% | 6% |
| (n) | (805) | (1,006) |
15.Do you find the holiday season generally more enjoyable or more stressful than the rest of the year, or is it no different?
| TREND: | Dec. 2022 | Dec. 2021 | Nov. 2018 | Dec. 2015 |
| More enjoyable | 41% | 36% | 41% | 44% |
| More stressful | 30% | 29% | 29% | 27% |
| No different | 27% | 32% | 27% | 23% |
| (VOL) Both | 2% | 2% | 3% | 5% |
| (VOL) Don’t know | 1% | 0% | 0% | 0% |
| (n) | (805) | (808) | (802) | (1,006) |
16A.How much do you enjoy shopping for holiday gifts – a great deal, a fair amount, some, not too much, or not at all?
| TREND: | Dec. 2022 | Dec. 2015 |
| Great deal | 15% | 18% |
| Fair amount | 18% | 20% |
| Some | 21% | 20% |
| Not too much | 19% | 17% |
| Not at all | 17% | 19% |
| (VOL) Don’t know | 1% | 1% |
| (VOL) Do not shop/celebrate | 8% | 4% |
| (n) | (805) | (1,006) |
16B.Have you cut back your shopping list this year because of high prices, or are you purchasing the same amount of gifts as usual? [If CUT BACK: Have you cut back by a lot or just a little?]
| TREND: | Dec. 2022 | Dec. 2021 |
| Cut back, a lot | 27% | 19% |
| Cut back, a little | 19% | 21% |
| Same as usual | 42% | 48% |
| (VOL) Don’t know | 2% | 2% |
| (VOL) Do not shop/celebrate | 10% | 10% |
| (n) | (805) | (808) |
17.Holiday songs can be traditional carols and religious songs, or non-religious songs about the holidays or winter in general. Do you have a favorite traditional carol or religious song about Christmas? [If YES: What is it?] [LIST WAS NOT READ]
| Dec. 2022 | |
| Silent Night | 12% |
| O Come All Ye Faithful | 2% |
| O Holy Night | 6% |
| O Little Town of Bethlehem | 1% |
| Little Drummer Boy | 2% |
| Joy to the World | 2% |
| Carol of the Bells | 3% |
| We Three Kings | 1% |
| O Come, O Come, Emmanuel | 1% |
| The First Noel | 1% |
| Mary, Did You Know | 2% |
| Hark! The Herald Angels Sing | 1% |
| Messiah / Hallelujah Chorus | 1% |
| What Child Is This | 1% |
| Away In a Manger | 1% |
| Other | 2% |
| Not sure | 5% |
| Do not have a favorite carol | 58% |
| (n) | (805) |
18.And do you have a favorite non-religious song about the holidays or winter in general? [If YES: What is it?] [LIST WAS NOT READ]
| Dec. 2022 | |
| Jingle Bells | 4% |
| Jingle Bell Rock | 1% |
| White Christmas | 3% |
| Baby It’s Cold Outside | 1% |
| All I Want for Christmas is You | 4% |
| We Wish You a Merry Christmas | 1% |
| Let It Snow | 1% |
| Winter Wonderland | 2% |
| Silver Bells | 1% |
| Santa Claus is Coming to Town | 1% |
| The Christmas Song (Chestnuts roasting…) | 2% |
| Rudolph the Red Nosed Reindeer | 2% |
| Frosty the Snowman | 1% |
| Rockin’ Around the Christmas Tree | 1% |
| Last Christmas | 2% |
| I’ll Be Home For Christmas | 1% |
| Here Comes Santa Claus | 1% |
| Have Yourself a Merry Little Christmas | 1% |
| Grandma Got Run Over by a Reindeer | 2% |
| Feliz Navidad | 1% |
| Blue Christmas | 1% |
| Happy Holiday | 1% |
| Other | 8% |
| Not sure | 2% |
| Do not have a favorite holiday song | 56% |
| (n) | (805) |
[Q19-29 held for future release.]
METHODOLOGY
The Monmouth University Poll was sponsored and conducted by the Monmouth University Polling Institute from December 8 to 12, 2022 with a probability-based national random sample of 805 adults age 18 and older. This includes 281 contacted by a live interviewer on a landline telephone and 524 contacted by a live interviewer on a cell phone, in English. Telephone numbers were selected through a mix of random digit dialing and list-based sampling. Landline respondents were selected with a modified Troldahl-Carter youngest adult household screen. Interviewing services were provided by Braun Research, with sample obtained from Dynata (RDD, n=590), Aristotle (list, n=152) and a panel of prior Monmouth poll participants (n=63). Monmouth is responsible for all aspects of the survey design, data weighting and analysis. The full sample is weighted for region, age, education, gender and race based on US Census information (ACS 2018 one-year survey). For results based on this sample, one can say with 95% confidence that the error attributable to sampling has a maximum margin of plus or minus 5.0 percentage points (adjusted for sample design effects). Sampling error can be larger for sub-groups (see table below). In addition to sampling error, one should bear in mind that question wording and practical difficulties in conducting surveys can introduce error or bias into the findings of opinion polls.
DEMOGRAPHICS (weighted) |
| Self-Reported |
| 26% Republican |
| 43% Independent |
| 31% Democrat |
| 49% Male |
| 51% Female |
| 30% 18-34 |
| 33% 35-54 |
| 37% 55+ |
| 64% White |
| 11% Black |
| 16% Hispanic |
| 9% Asian/Other |
| 69% No degree |
| 31% 4 year degree |
Click on pdf file link below for full methodology and crosstabs by key demographic groups.


