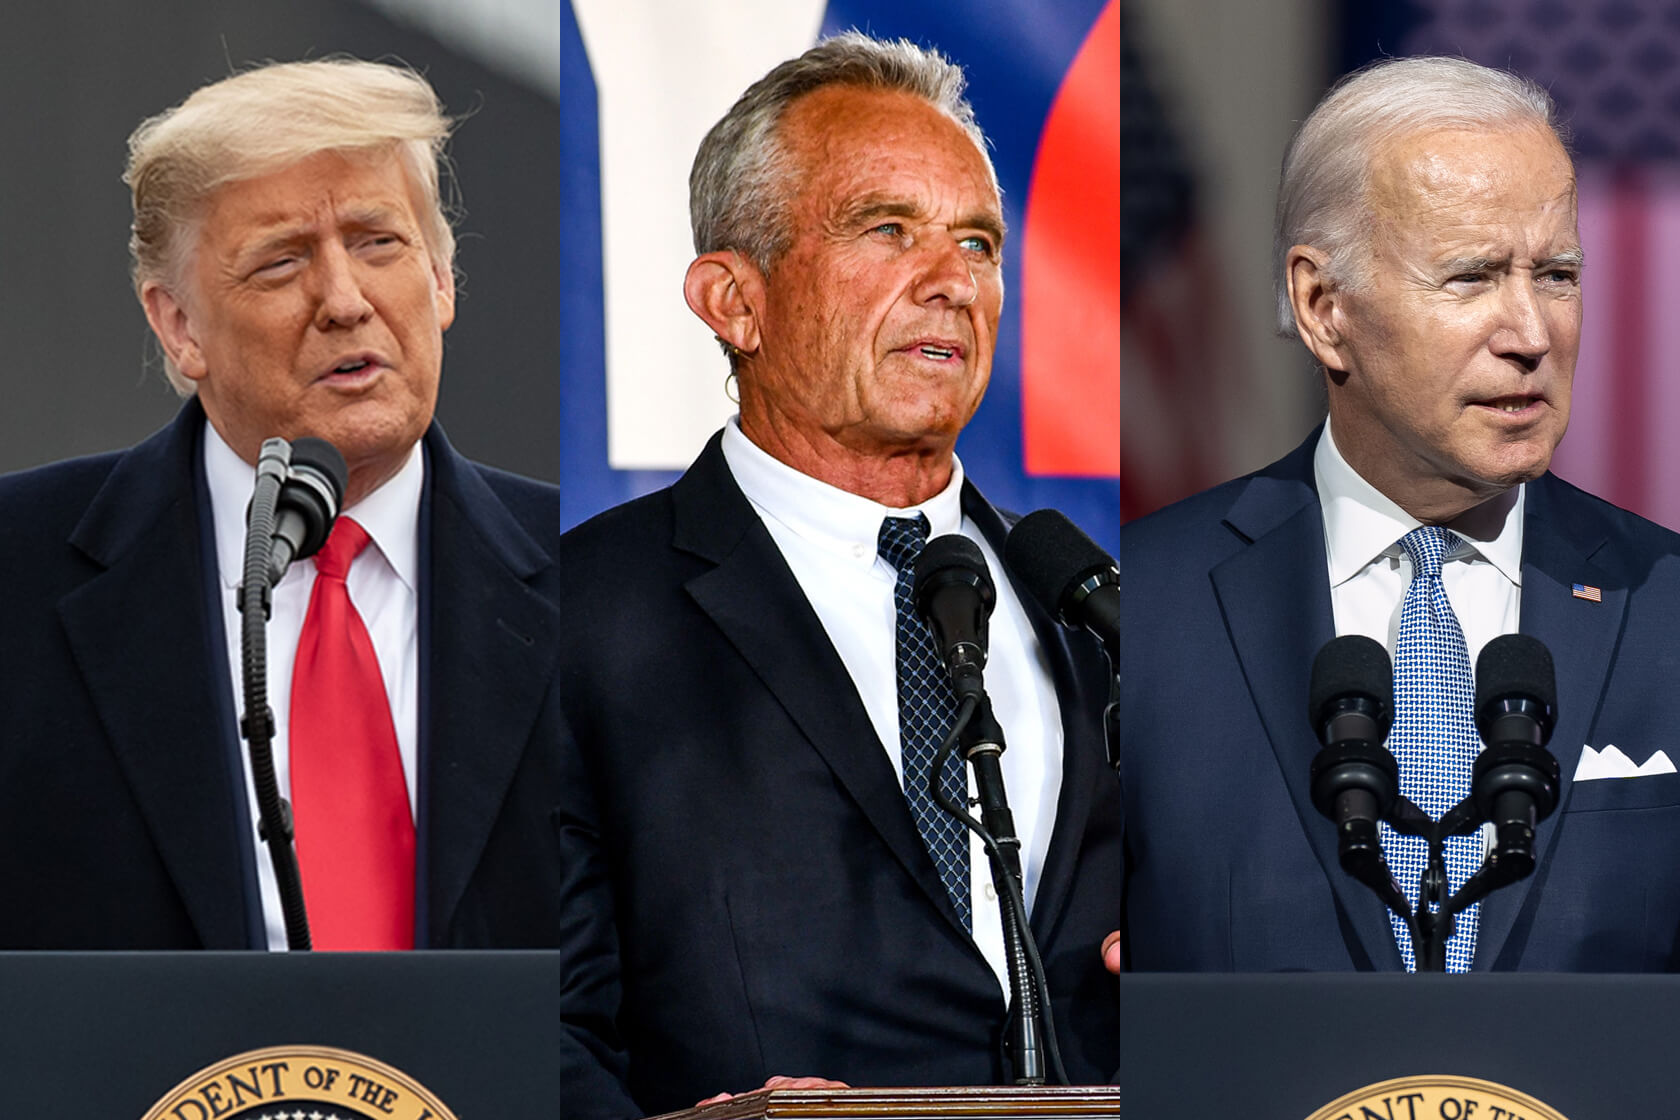
West Long Branch, NJ – Only 1 in 4 voters express at least some enthusiasm about a rematch between Joe Biden and Donald Trump next year and 1 in 5 may cast a vote for independent candidate Robert F. Kennedy Jr. in 2024. However, the Monmouth (“Mon-muth”) University Poll finds Kennedy’s potential impact on the race is uncertain, as he pulls support equally from both major party candidates.
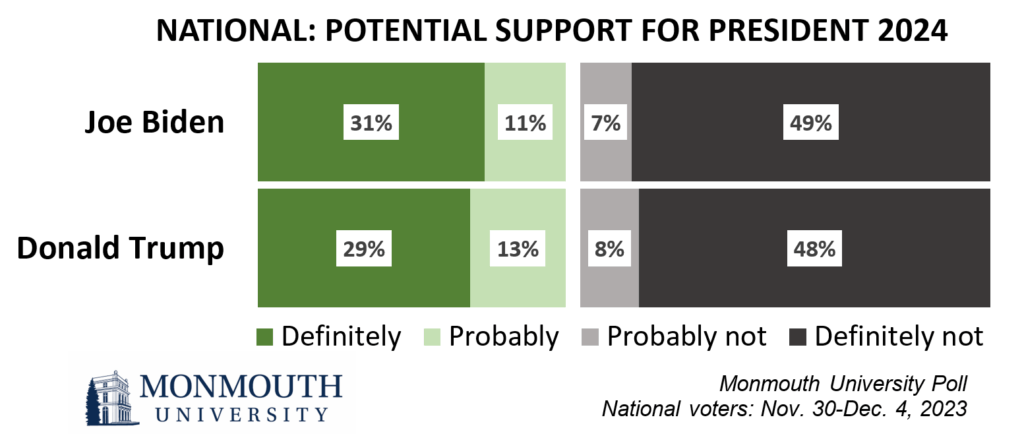
In a Biden-Trump rematch scenario, just over 4 in 10 registered voters say they will either definitely (31%) or probably (11%) vote for the Democratic incumbent and, in a separate question, the same number will definitely (29%) or probably (13%) support the former Republican president. Trump is doing a little better at holding onto his 2020 voters than Biden. Based on poll respondents’ self-reported vote in the last election, 91% of 2020 Trump supporters say they will vote for him again compared with 85% of 2020 Biden voters who say the same about him.

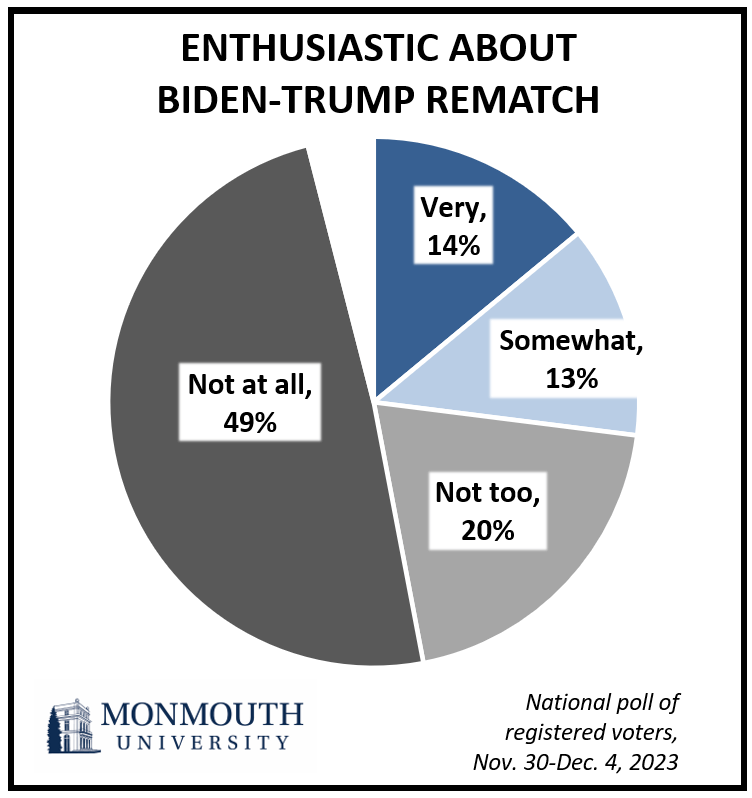
About one-quarter of the electorate expresses any level of enthusiasm for the possibility of a replay of the 2020 contest. This includes just 14% who are very enthusiastic and 13% who are somewhat enthusiastic about a Biden-Trump rematch, but there are partisan differences in this opinion. Republicans (47%) are much more likely than either Democrats (21%) or independents (18%) to be at least somewhat enthusiastic about seeing Biden and Trump face off again.

“There’s a desire among some Republicans to exact revenge for what they see as a stolen election. But for most voters, 2020 is an election they’d rather not have to relive,” said Patrick Murray, director of the independent Monmouth University Polling Institute. “The question is whether this discontent creates an opening for someone else.”
About half the electorate will definitely not vote for Biden (49%) and a nearly identical number will definitely not vote for Trump (48%). When the two questions about candidate support are taken together, about 1 in 6 American voters (16%) say they will not vote for either man. This includes 24% of independents, 14% of Republicans and 9% of Democrats. The size of this “none of the above” bloc is one reason why Kennedy’s presidential bid has garnered media attention.
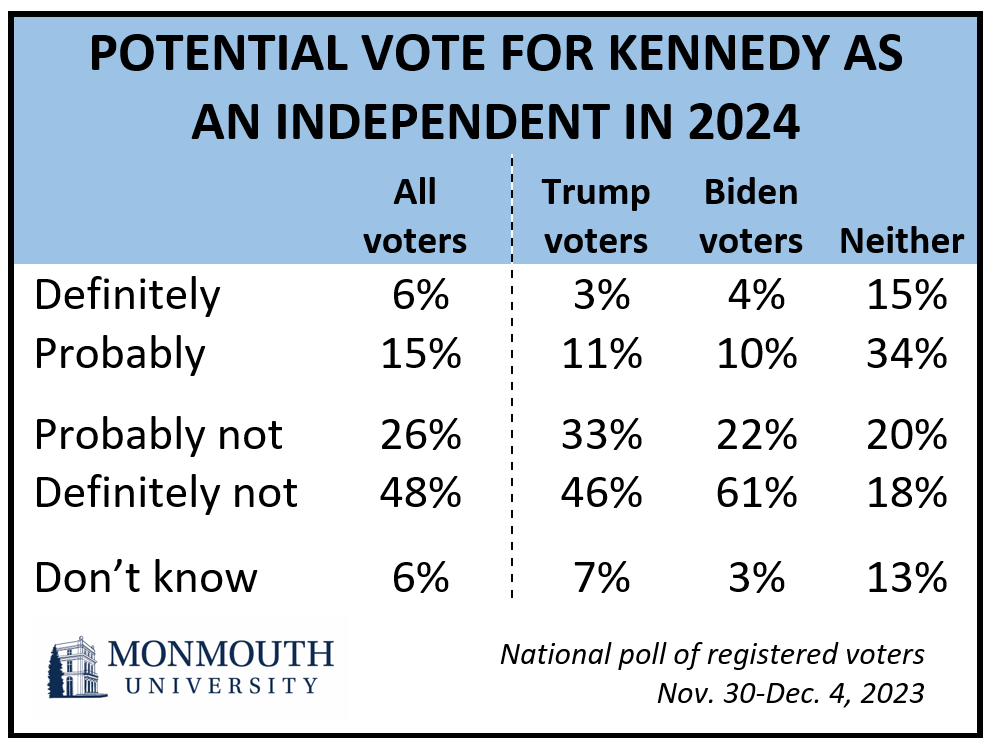
One in five voters indicate some likelihood of casting a vote for Kennedy in a presidential contest that features Biden and Trump. This includes 6% who say they definitely will vote for Kennedy and 15% who probably will. If all these voters followed through on what they are now telling pollsters, their support for Kennedy would cost each major party nominee 14% of their current base. However, focusing just on those who will definitely vote for Kennedy, Biden loses just 4% of his current support and Trump loses only 3%. Among voters who are not backing either Biden or Trump at this time, about half say they will definitely (15%) or probably (34%) support Kennedy. Another way to look at these results is that about 3 in 10 potential Kennedy supporters would otherwise be inclined to vote for Trump and a similar 3 in 10 would otherwise lean toward Biden, with the remaining 4 in 10 Kennedy backers being people who do not support either major party candidate.

“We are seeing a pretty even contest so far. This may be the case whether or not Kennedy is running, at least at this early stage before voters have really tuned in to the alternatives,” said Murray.
Currently, 24% of American voters have a favorable opinion of Kennedy while 34% hold an unfavorable view. Despite his family pedigree, Democrats (55% unfavorable) are much more likely than Republicans (17% unfavorable) to have a negative opinion of Kennedy. While other voters have no opinion of the activist and lawyer, only 13% say they have never heard of Kennedy.
The Monmouth University Poll finds just half (50%) of the voting public is aware Kennedy supports claims that autism is linked to vaccines and has said that Covid is “targeted to attack” people of certain races. This information however does not seem to have any meaningful impact on his support among American voters. The number who will definitely or probably vote for Kennedy after hearing this information moves a statistically insignificant one point upwards to 22% while the number who probably or definitely will not vote for him goes up by just two points to 76%.
“Kennedy’s name may be well-known, but his policy positions are not. However, it’s not clear that knowing those positions will move his support levels either up or down. At the current time, he appears to be more of a placeholder for expressing some generalized dissatisfaction with the likely trajectory of the 2024 nomination process,” said Murray.
The Monmouth University Poll was conducted by telephone from November 30 to December 4, 2023 with 803 adults in the United States. The question results in this release are based on 743 registered voters and have a margin of error +/- 5.0 percentage points. The poll was conducted by the Monmouth University Polling Institute in West Long Branch, NJ.
QUESTIONS AND RESULTS
(* Some columns may not add to 100% due to rounding.)
[Q1-12 held for future release.]
[QUESTIONS 13 & 14 WERE ROTATED]
Looking ahead to next year’s presidential election, imagine the Democratic nominee is Joe Biden and the Republican nominee is Donald Trump. In this scenario…
13.How likely are you to vote for Donald Trump – will you definitely vote for him, probably vote for him, probably not vote for him, or definitely not vote for him?
| Trend: Registered voters | Dec. 2023 | Sept. 2023 | July 2023 | May 2023 |
|---|---|---|---|---|
| Definitely | 29% | 31% | 26% | 29% |
| Probably | 13% | 12% | 14% | 12% |
| Probably not | 8% | 8% | 8% | 8% |
| Definitely not | 48% | 48% | 50% | 46% |
| (VOL) Don’t know | 2% | 1% | 1% | 4% |
| (n) | (743) | (737) | (840) | (907) |
14.How likely are you to vote for Joe Biden – will you definitely vote for him, probably vote for him, probably not vote for him, or definitely not vote for him?
| Trend: Registered voters | Dec. 2023 | Sept. 2023 | July 2023 | May 2023 |
|---|---|---|---|---|
| Definitely | 31% | 31% | 36% | 32% |
| Probably | 11% | 11% | 11% | 13% |
| Probably not | 7% | 6% | 6% | 7% |
| Definitely not | 49% | 51% | 46% | 45% |
| (VOL) Don’t know | 1% | 1% | 1% | 3% |
| (n) | (743) | (737) | (840) | (907) |
15.How do you feel about the possibility of a rematch between Joe Biden and Donald Trump in 2024? Are you very enthusiastic, somewhat enthusiastic, not too enthusiastic, or not at all enthusiastic?
| Registered voters | Dec. 2023 |
|---|---|
| Very enthusiastic | 14% |
| Somewhat enthusiastic | 13% |
| Not too enthusiastic | 20% |
| Not at all enthusiastic | 49% |
| (VOL) Don’t know | 3% |
| (n) | (743) |
16.Have you heard of lawyer and activist Robert F. Kennedy Jr. or have you not heard of him? [If HEARD: Is your general impression of Robert F. Kennedy Jr. favorable or unfavorable, or do you have no opinion of him?]
| Registered voters | Dec. 2023 |
|---|---|
| Favorable | 24% |
| Unfavorable | 34% |
| No opinion | 30% |
| Not heard of | 13% |
| (n) | (743) |
17.In an election for president where the major party nominees are Joe Biden and Donald Trump, how likely are you to vote for Robert F. Kennedy Jr. as an independent candidate – will you definitely vote for him, probably vote for him, probably not vote for him, or definitely not vote for him?
| Registered voters | Dec. 2023 |
|---|---|
| Definitely | 6% |
| Probably | 15% |
| Probably not | 26% |
| Definitely not | 48% |
| (VOL) Don’t know | 6% |
| (n) | (743) |
18.Have you heard anything about Kennedy’s positions on public health issues such as Covid and vaccines, or have you not heard anything about this?
| Registered voters | Dec. 2023 |
|---|---|
| Have heard | 53% |
| Have not heard | 47% |
| (n) | (743) |
19.Kennedy supports claims that autism is linked to vaccines and has said that Covid is targeted to attack people of certain races. Were you aware that he held these views, or were you not aware before now?
| Registered voters | Dec. 2023 |
|---|---|
| Aware | 50% |
| Not aware before now | 48% |
| (VOL) Don’t know | 2% |
| (n) | (743) |
20.Knowing this about Kennedy’s views on public health issues, how likely are you to vote for him as an independent candidate for president – will you definitely vote for him, probably vote for him, probably not vote for him, or definitely not vote for him?
| Registered voters | Dec. 2023 |
|---|---|
| Definitely | 5% |
| Probably | 17% |
| Probably not | 26% |
| Definitely not | 50% |
| (VOL) Don’t know | 2% |
| (n) | (743) |
21.Did you vote in the 2020 presidential election, or did you not vote for whatever reason? [If YES: Who did you vote for – Donald Trump, Joe Biden, or another candidate?] [NAMES WERE ROTATED]
| Registered voters | Dec. 2023 |
|---|---|
| Donald Trump | 40% |
| Joe Biden | 45% |
| Another candidate | 4% |
| Voted, refused to name candidate | 2% |
| Did not vote | 9% |
| (n) | (743) |
[Q22-36 previously released.]
METHODOLOGY
The Monmouth University Poll was sponsored and conducted by the Monmouth University Polling Institute from November 30 to December 4, 2023 with a probability-based national random sample of 803 adults age 18 and older. Interviews were conducted in English, and included 250 live landline telephone interviews, 348 live cell phone interviews, and 205 online surveys via a cell phone text invitation. Telephone numbers were selected through a mix of random digit dialing and list-based sampling. Landline respondents were selected with a modified Troldahl-Carter youngest adult household screen. Interviewing services were provided by Braun Research, with sample obtained from Dynata (RDD, n= 522), Aristotle (list, n= 120) and a panel of prior Monmouth poll participants (n= 161). Monmouth is responsible for all aspects of the survey design, data weighting and analysis. The full sample is weighted for region, age, education, gender and race based on US Census information (ACS 2021 one-year survey). The results in this poll release are based on a subsample of 743 registered voters. For results based on the sample of registered voters, one can say with 95% confidence that the error attributable to sampling has a maximum margin of plus or minus 5.0 percentage points adjusted for sample design effects (1.91). Sampling error can be larger for sub-groups (see table below). In addition to sampling error, one should bear in mind that question wording and practical difficulties in conducting surveys can introduce error or bias into the findings of opinion polls.
Demographics (weighted)
Party (self-reported): 30% Republican, 38% Independent, 32% Democrat
Sex: 49% Male, 50% Female, 1% Other
Age: 26% 18-34, 33% 35-54, 41% 55+
Race: 64% White, 12% Black, 14% Hispanic, 9% Asian/Other
Education: 35% High school or less, 30% Some college, 17% 4 year degree, 18% Graduate degree
Click on pdf file link below for full methodology and crosstabs by key demographic groups.


