
West Long Branch, NJ – Most Americans say inflation has led to cutbacks to their shopping list this holiday season. Despite this, the Monmouth (“Mon-muth”) University Poll finds the vast majority will still partake in many traditional holiday activities – except, that is, for carol singing. Among other poll results, nearly 8 in 10 Americans believe they are making Santa’s “nice list” this year and frosted sugar cookies come out on top as the nation’s favorite holiday bake.
A majority of Americans (55%) report cutting back on their holiday shopping list this year because of high prices. This number has steadily increased from 46% who said the same last year and 40% in 2021. This increase in cuts to holiday shopping has happened among all demographic groups, but is greatest among those earning less than $50,000 a year. Fully two-thirds (67%) of this lower income group have cut back this year compared with just under half (48%) who said the same in 2022.
“The rate of inflation may be slowing but the damage has been done after a long stretch of rising prices. There could be a number of reasons why more are cutting back this season. Perhaps those who kept to their usual spending habits as we came out of the pandemic are seeing it catch up with them now. Or maybe their budgets are the same, but they are exchanging fewer gifts or buying for fewer people. Whatever the reason, there is greater pessimism on the holiday gift-giving front,” said Patrick Murray, director of the independent Monmouth University Polling Institute.
Despite making cuts to their gift lists, most Americans plan on diving into a full range of holiday activities. This includes playing Christmas music (76%), decorating their homes (75%), and making Christmas candy, cookies or desserts (69%). More than 4 in 10 (43%) also say they will volunteer for charitable activities this holiday season. These current results are between 5 and 8 percentage points higher than they were in a national poll conducted for U.S. News & World Report magazine nearly 30 years ago. On the other hand, very few Americans (9%) plan to go caroling this year, which is down from an already low 22% recorded in the 1996 poll.
Speaking of holiday baking, nearly half of the country has a favorite Christmas cookie. Among those who can make a single choice, frosted sugar cookies lead the list (32%), with gingerbread (12%) and chocolate chip (11%) rounding out the top three. Snickerdoodles (6%) come in fourth place, followed by butter (4%), peanut butter (4%), and chocolate (4%) tying for fifth. Many other varieties are also represented on the list, although some of those polled simply said something like “mom’s cookies.”
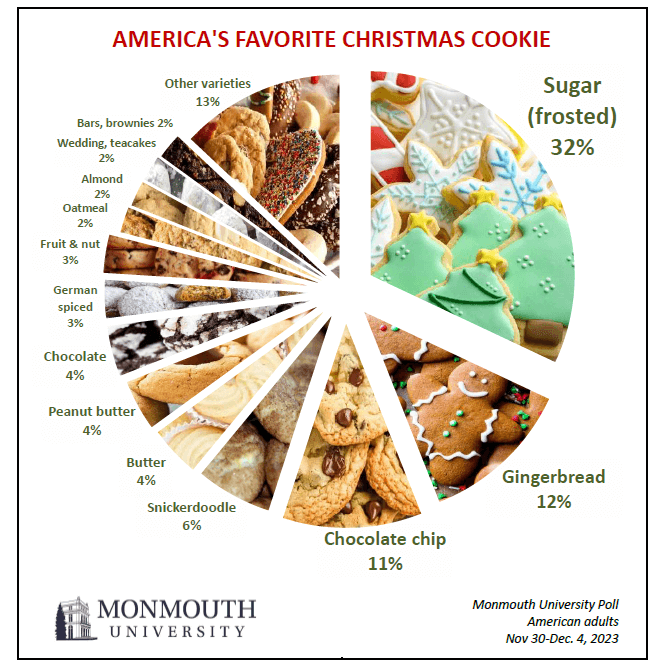
“If you want to please your family’s palate this holiday season, your best bet is icing up a batch of Christmas tree or snowflake shaped sugar cookies. But frankly, you really can’t go wrong with pretty much any cookie on this list,” said Murray.
The poll also asked Americans which of Santa Claus’ lists they think they’ll end up on this year. The vast majority (79%) say they are definitely making the “nice list.” Just 10% feel they’ll find their names on Santa’s “naughty list” and another 11% are unsure about which list they will end up on. More women (87%) than men (72%) believe they have been put on Santa’s nice list.
Women (80%) are also more likely than men (59%) to plan on making holiday goodies and are more likely to name a favorite Christmas cookie (55% of women and 40% of men). In other demographic findings from the poll, slightly more women (82%) than men (71%) play Christmas tunes during the season. Among adults under the age of 55, those with children at home (80%) are more likely than those without children (64%) to decorate their houses. Parents (55%) are also more likely than others to plan on volunteering this holiday season.
The Monmouth University Poll was conducted by telephone from November 30 to December 4, 2023 with 803 adults in the United States. The question results in this release have a margin of error of +/- 4.8 percentage points for the full sample. The poll was conducted by the Monmouth University Polling Institute in West Long Branch, NJ.
QUESTIONS AND RESULTS
(* Some columns may not add to 100% due to rounding.)
[Q1-21 held for future release.]
22.Do you celebrate Christmas, Hanukkah, Kwanzaa, or none of these holidays? [If YES:Which?] [Note: Results add to more than 100% because multiple responses were accepted.]
| Trend: | Dec. 2023 | Dec. 2022 | Dec. 2021 | Nov. 2018 | Dec. 2017 | Dec. 2015 |
|---|---|---|---|---|---|---|
| Christmas | 89% | 89% | 91% | 90% | 89% | 94% |
| Hanukkah | 7% | 7% | 7% | 6% | 5% | 6% |
| Kwanzaa | 5% | 3% | 5% | 4% | 3% | 3% |
| None of these | 9% | 8% | 7% | 7% | 8% | 4% |
| (VOL) Don’t know | 1% | 0% | 1% | 1% | 1% | 1% |
| (n) | (803) | (805) | (808) | (802) | (806) | (1,006) |
23.Have you cut back your shopping list this year because of high prices, or are you purchasing the same amount of gifts as usual? [If CUT BACK: Have you cut back by a lot or just a little?]
| Trend: | Dec. 2023 | Dec. 2022 | Dec. 2021 |
|---|---|---|---|
| Cut back, a lot | 36% | 27% | 19% |
| Cut back, a little | 19% | 19% | 21% |
| Same as usual | 32% | 42% | 48% |
| (VOL) Don’t know | 1% | 2% | 2% |
| (VOL) Do not shop/celebrate | 12% | 10% | 10% |
| (n) | (803) | (805) | (808) |
24.Which of the following activities do you usually participate in during the holiday season? Do you [READ ITEM]? [ITEMS WERE ROTATED]
| Trend: | Dec. 2023 | Nov. 1996* |
|---|---|---|
| Make Christmas candy, cookies, or desserts | 69% | 61% |
| Decorate your home | 75% | 70% |
| Play Christmas music | 76% | 68% |
| Go caroling | 9% | 22% |
| Volunteer for charitable activities | 43% | 36% |
| (n) | (803) | (1,003) |
25.Do you have a favorite Christmas cookie (or favorite cookie for the holidays
| Response: | Dec. 2023 |
|---|---|
| Yes | 47% |
| No | 51% |
| (VOL) Don’t know | 1% |
| (n) | (803) |
[Question 25A was asked of those who have a favorite Christmas/holiday cookie in Q25; n=395, moe=+/-6.8%.]
25A.Do you have a favorite Christmas cookie (or favorite cookie for the holidays?) [If YES: What is it?] [LIST WAS NOT READ]
| Response: | Dec. 2023 |
|---|---|
| Gingerbread | 12% |
| Chocolate chip | 11% |
| Snickerdoodle | 6% |
| Sugar, frosted | 32% |
| Butter | 4% |
| Almond | 2% |
| Peanut butter | 4% |
| Oatmeal | 2% |
| Thumbprint | 1% |
| Wedding, teacakes | 2% |
| Chocolate | 4% |
| Italian | 1% |
| Fruit & nuts | 3% |
| German spiced | 3% |
| Jam, Linzer | 1% |
| Shortbread | 1% |
| Bars, brownies | 2% |
| Other | 10% |
| (n) | (803) |
26.Thinking about what you have done during the past year, do you think Santa Claus would put you on his naughty list or nice list?
| Response: | Dec. 2023 |
|---|---|
| Naughty list | 10% |
| Nice list | 79% |
| (VOL) Don’t know | 11% |
| (n) | (803) |
[Q27-36 previously released.]
METHODOLOGY
The Monmouth University Poll was sponsored and conducted by the Monmouth University Polling Institute from November 30 to December 4, 2023 with a probability-based national random sample of 803 adults age 18 and older. Interviews were conducted in English, and included 250 live landline telephone interviews, 348 live cell phone interviews, and 205 online surveys via a cell phone text invitation. Telephone numbers were selected through a mix of random digit dialing and list-based sampling. Landline respondents were selected with a modified Troldahl-Carter youngest adult household screen. Interviewing services were provided by Braun Research, with sample obtained from Dynata (RDD, n= 522), Aristotle (list, n= 120) and a panel of prior Monmouth poll participants (n= 161). Monmouth is responsible for all aspects of the survey design, data weighting and analysis. The full sample is weighted for region, age, education, gender and race based on US Census information (ACS 2021 one-year survey). For results based on this sample, one can say with 95% confidence that the error attributable to sampling has a maximum margin of plus or minus 4.8 percentage points adjusted for sample design effects (1.92). Sampling error can be larger for sub-groups (see table below). In addition to sampling error, one should bear in mind that question wording and practical difficulties in conducting surveys can introduce error or bias into the findings of opinion polls.
Demographics (weighted)
Party (self-reported): 28% Republican, 41% Independent, 31% Democrat
Sex: 48% Male, 50% Female
Age: 28% 18-34, 33% 35-54, 39% 55+
Race: 62% White, 12% Black, 16% Hispanic, 9% Asian/Other
Education: 38% High school or less, 29% Some college, 17% 4 year degree, 16% graduate degree
Click on pdf file link below for full methodology and crosstabs by key demographic groups.


