
West Long Branch, NJ – Donald Trump continues to hold majority backing among the national Republican electorate in his bid to return to the White House. In fact, the latest Monmouth (“Mon-muth”) University Poll finds that most supporters of the former president would have preferred a primary where no one opposed him for the GOP nomination. At the other end of the party, those who want someone other than Trump as the Republican standard-bearer are split on whether the remaining candidates should coalesce around a single challenger to the front-runner.
In an open-ended question asking Republican voters whom they would like to see as the GOP nominee for president, 53% name Trump. This top-of-mind preference has steadily climbed from a year ago when it stood at just 26%. In a subsequent question listing seven candidates in the race at the time the poll was taken, Trump’s support stands at 58%. Far back in the pack are Florida Gov. Ron DeSantis (18%), former U.N. Ambassador and South Carolina Gov. Nikki Haley (12%), entrepreneur Vivek Ramaswamy (4%), and former New Jersey Gov. Chris Christie (2%).
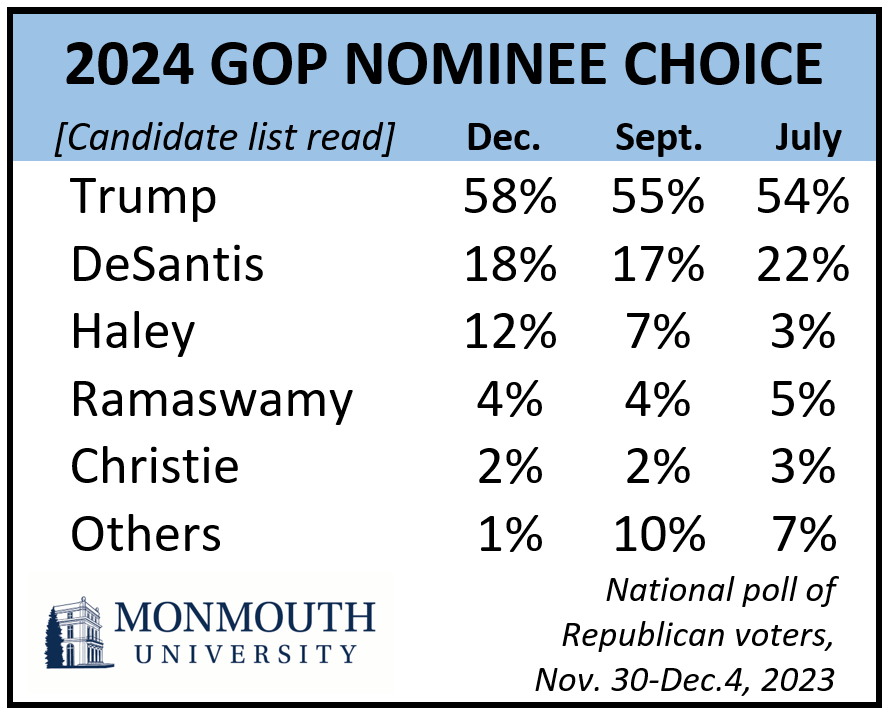
Compared to where the candidates stood in July, Haley has experienced the greatest movement, rising 9 points from 3%. This is mainly due to an increase in support among non-MAGA Republicans and those with a college degree. Still, she remains far behind the front-runner.
The vast majority of Republican voters continue to feel Trump would be their party’s strongest nominee, with 54% saying he would definitely be the strongest candidate against Biden in 2024, which is up from 48% who said the same in September and 45% in July. Interestingly, 41% of Republicans who currently support another candidate actually feel that Trump would be the strongest candidate against Biden. This finding has been fairly consistent since the summer.
“We can parse these numbers until the cows come home, but the results don’t look good for any candidate not named Trump. Certainly, there is always an outside chance of an upset in an early primary shaking things up, but most Republicans seem to anticipate an inevitable outcome,” said Patrick Murray, director of the independent Monmouth University Polling Institute.
The poll asked Republican voters about their preferences for contesting the 2024 primary based on whether or not they currently support the former president. Among Trump backers, fully 63% would have preferred a primary where other candidates stepped aside in favor of Trump. Just 28% of Trump voters preferred a primary with others running against Trump.
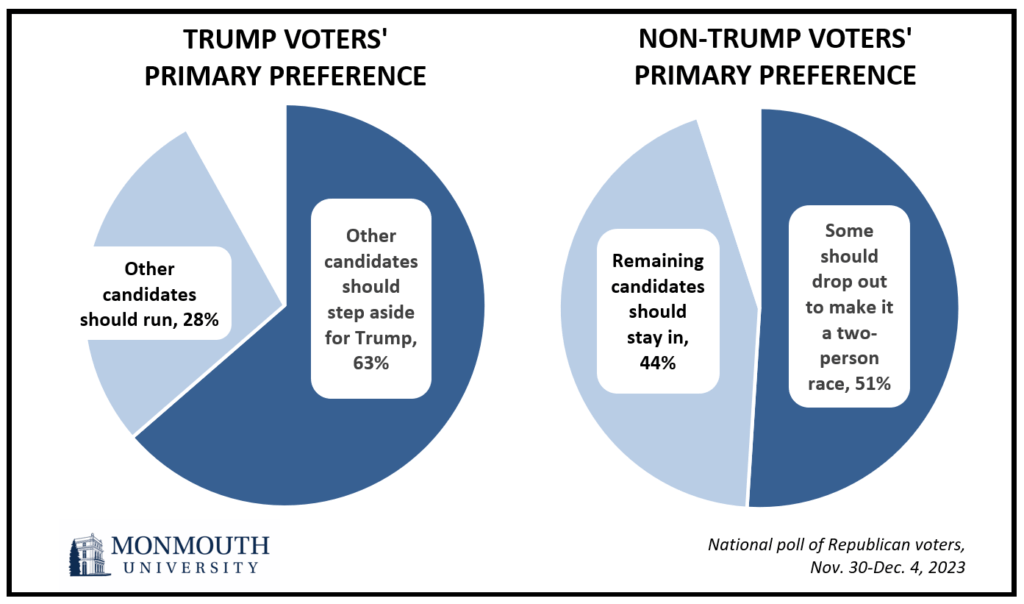
Among Republican voters who currently support a candidate other than Trump, 51% say some candidates should drop out so it can be a two-person race with just one candidate facing Trump. However, a sizable 44% say the remaining candidates should stay in the race and let the chips fall where they may during the primaries. Nearly 2 in 3 DeSantis supporters – who actually led Trump in the Monmouth University Poll at the start of the year – would like to see the other candidates coalesce around a single challenger, but Haley backers are more divided on this question.
“Most Trump voters feel he should have been given the deference of an incumbent. Among Republicans who want an alternative, though, there isn’t really a clear sense that a viable contender has emerged who they can rally around,” said Patrick Murray, director of the independent Monmouth University Polling Institute.
Both Trump (76% favorable and 18% unfavorable) and DeSantis (62% favorable and 19% unfavorable) enjoy high personal ratings among Republican voters, while opinion of Christie is broadly negative (12% favorable and 65% unfavorable). These results are generally in line with Monmouth polls taken over the past few months. At the same time, Haley’s visibility has risen over the past few months, but her favorable numbers have dropped slightly (42%) and her unfavorable rating has gone up (30%). Ramaswamy has also seen a similar negative shift in his ratings (36% favorable and 23% unfavorable).
Monmouth added two questions after the House of Representatives voted to expel George Santos on Friday. The results from this partial sample of Republican voters show that just 6% have a favorable opinion of the now-former New York congressman while 46% hold an unfavorable view of him. Half of the GOP electorate has no opinion on the decision to oust Santos from office, but among the rest more approve (34%) than disapprove (17%) of this action. That gap is narrower among Trump voters (30% approve and 20% disapprove) than it is among Republicans who support another candidate for the party’s presidential nomination (43% approve and 11% disapprove).
“Few Republican voters shed a tear about Santos’ departure from Congress,” said Murray.
The Monmouth University Poll was conducted by telephone and online from November 30 to December 4, 2023 with 540 Republican and Republican leaning voters in the United States. The question results in this release have a margin of error of +/- 5.4 percentage points for the full sample. The poll was conducted by the Monmouth University Polling Institute in West Long Branch, NJ.
QUESTIONS AND RESULTS
(* Some columns may not add to 100% due to rounding.)
[Q1-26 from national poll of all adults held for future release.]
27.Looking ahead, who would you like to see as the Republican nominee for President in 2024? [OPEN-END QUESTION. LIST WAS NOT READ.]
| Trend: | Dec. 2023 | Sept. 2023 | July 2023 | May 2023 | March 2023 | Feb. 2023 | Dec. 2022 |
|---|---|---|---|---|---|---|---|
| Donald Trump | 53% | 48% | 46% | 43% | 41% | 33% | 26% |
| Ron DeSantis | 11% | 15% | 20% | 19% | 27% | 33% | 39% |
| Mike Pence | <1% | 1% | 1% | 3% | 1% | 2% | 2% |
| Nikki Haley | 10% | 6% | 2% | 1% | 3% | 1% | 1% |
| Vivek Ramaswamy | 3% | 4% | 3% | 1% | 0% | 0% | 0% |
| Tim Scott | <1% | 3% | 3% | 3% | 1% | <1% | <1% |
| Asa Hutchinson | <1% | <1% | 0% | 0% | 0% | 0% | 0% |
| Chris Christie | 1% | 1% | 1% | <1% | 0% | 0% | 0% |
| Doug Burgum | 0% | <1% | <1% | 0% | 0% | 0% | 0% |
| Others | 3% | 3% | 5% | 7% | 6% | 7% | 7% |
| (VOL) Don’t know | 19% | 20% | 19% | 23% | 23% | 24% | 25% |
| (n) | (540) | (514) | (681) | (655) | (521) | (566) | (563) |
28.I’m going to read you the names of candidates running for president in the Republican Party. Please tell me if your general impression of each is favorable or unfavorable, or if you don’t really have an opinion. If you have not heard of the person, just let me know. First, [READ NAME]. [NAMES WERE ROTATED]
| Trend: | Favorable | Unfavorable | No opinion | Not heard of | (n) |
|---|---|---|---|---|---|
| Former President Donald Trump | 76% | 18% | 5% | 0% | (540) |
| — Sept. 2023 | 79% | 17% | 4% | 0% | (514) |
| — July 2023 | 77% | 18% | 5% | 0% | (681) |
| — May 2023 | 77% | 17% | 6% | 0% | (655) |
| — March 2023 | 71% | 21% | 8% | 0% | (521) |
| — Feb. 2023 | 74% | 18% | 8% | 0% | (566) |
| Florida Governor Ron DeSantis | 62% | 19% | 15% | 4% | (540) |
| — Sept. 2023 | 64% | 20% | 14% | 2% | (514) |
| — July 2023 | 65% | 18% | 13% | 4% | (681) |
| — May 2023 | 73% | 12% | 11% | 3% | (655) |
| — March 2023 | 76% | 8% | 11% | 5% | (521) |
| — Feb. 2023 | 80% | 6% | 11% | 3% | (566) |
| Former South Carolina Governor and U.N. Ambassador Nikki Haley | 42% | 30% | 17% | 12% | (540) |
| — Sept. 2023 | 47% | 21% | 20% | 12% | (514) |
| — July 2023 | 42% | 20% | 25% | 13% | (681) |
| — May 2023 | 47% | 16% | 23% | 14% | (655) |
| — March 2023 | 45% | 16% | 23% | 16% | (521) |
| — Feb. 2023 | 47% | 11% | 22% | 19% | (566) |
| Business entrepreneur Vivek Ramaswamy | 36% | 23% | 25% | 17% | (540) |
| — Sept. 2023 | 42% | 17% | 22% | 19% | (514) |
| — July 2023 | 32% | 9% | 23% | 37% | (681) |
| — May 2023 | 22% | 6% | 26% | 46% | (655) |
| — March 2023 | 17% | 6% | 28% | 49% | (521) |
| — Feb. 2023 | n/a | n/a | n/a | n/a | n/a |
| Former New Jersey Governor Chris Christie | 12% | 65% | 17% | 7% | (540) |
| — Sept. 2023 | 10% | 66% | 19% | 5% | (514) |
| — July 2023 | 18% | 55% | 20% | 7% | (681) |
| — May 2023 | 21% | 47% | 24% | 8% | (655) |
| — March 2023 | 24% | 42% | 28% | 6% | (521) |
| — Feb. 2023 | n/a | n/a | n/a | n/a | n/a |
29.Of the following candidates, which one do you most support for the Republican nomination? [NAMES WERE ROTATED]
| Trend: | Dec. 2023 | Sept. 2023 | July 2023 |
|---|---|---|---|
| Donald Trump | 58% | 55% | 54% |
| Ron DeSantis | 18% | 17% | 22% |
| Nikki Haley | 12% | 7% | 3% |
| Vivek Ramaswamy | 4% | 4% | 5% |
| Chris Christie | 2% | 2% | 3% |
| Asa Hutchinson | <1% | 1% | <1% |
| Doug Burgum | 1% | 1% | 1% |
| Mike Pence | n/a | 3% | 3% |
| Tim Scott | n/a | 5% | 3% |
| (VOL) None of these | 0% | 2% | 2% |
| (VOL) Don’t know | 5% | 4% | 4% |
| (n) | (540) | (514) | (681) |
[Question 30 was asked of those who support Trump in Q29; n=287, moe=+/-7.5%.]
30.While anyone qualified has the right to run for president, would you prefer to have seen a primary…? [CHOICES WERE ROTATED]
| Trump voters: | Dec. 2023 |
|---|---|
| Where other Republican candidates stepped aside in favor of Trump | 63% |
| Where other Republican candidates ran against Trump | 28% |
| (VOL) Don’t know | 8% |
| (n) | (287) |
[Question 31 was asked of those who do not support Trump in Q29; n=253, moe=+/-8.0%.]
31.Which of the following would you prefer for the Republican nomination contest? [CHOICES WERE ROTATED]
| Not Trump voters: | Dec. 2023 |
|---|---|
| Some candidates should drop out so it can be a two-person race with just one candidate facing Trump | 51% |
| The remaining candidates should stay in and let the chips fall where they may during the primaries | 44% |
| (VOL) Don’t know | 5% |
| (n) | (253) |
32.Regardless of whether you currently support Donald Trump, which of the following statements comes closest to your view about which Republican has the best chance to win in 2024: Donald Trump is definitely the strongest candidate to beat Joe Biden, Donald Trump is probably the strongest candidate to beat Joe Biden, another Republican would probably be a stronger candidate than Trump, or another Republican would definitely be a stronger candidate than Trump?
| Trend: | Dec. 2023 | Sept. 2023 | July 2023 | May 2023 |
|---|---|---|---|---|
| Trump definitely strongest | 54% | 48% | 45% | 45% |
| Trump probably strongest | 19% | 24% | 24% | 18% |
| Another Republican probably stronger | 16% | 17% | 18% | 19% |
| Another Republican definitely stronger | 10% | 8% | 13% | 13% |
| (VOL) Don’t know | 2% | 2% | 1% | 4% |
| (n) | (540) | (514) | (681) | (655) |
[Note: Question 33 was asked 12/1-12/4; n=353, m.o.e. = +/-6.7%]
33.Is your general impression of former New York Congressman George Santos favorable, or unfavorable, or do you have no opinion of him?
| Trend: | Dec. 2023 | Feb. 2023 |
|---|---|---|
| Favorable | 6% | 12% |
| Unfavorable | 46% | 42% |
| No opinion | 47% | 46%* |
| (n) | (353) | (566) |
[Note: Question 34 was asked 12/1-12/4; n=353, m.o.e. = +/-6.7%]
34.Do you approve or disapprove of the House of Representatives voting to expel George Santos from Congress, or do you have no opinion on that?
| Response: | Dec. 2023 |
|---|---|
| Approve | 34% |
| Disapprove | 17% |
| No opinion | 49% |
| (n) | (353) |
35.Would you describe yourself as a born-again or evangelical Christian, or not?
| Trend: | Dec. 2023 | Sept. 2023 | July 2023 | May 2023 | March 2023 |
|---|---|---|---|---|---|
| Yes | 51% | 47% | 50% | 55% | 53% |
| No | 46% | 50% | 48% | 42% | 46% |
| (VOL) Don’t know | 3% | 3% | 2% | 3% | 1% |
| (n) | (540) | (514) | (681) | (655) | (521) |
36.Would you describe yourself as a supporter of the MAGA movement, or not? [If YES: Do you support MAGA strongly or just somewhat?]
| Trend: | Dec. 2023 | Sept. 2023 | July 2023 | March 2023 |
|---|---|---|---|---|
| Supporter, strong | 34% | 36% | 31% | 38% |
| Supporter, somewhat | 21% | 22% | 21% | 28% |
| Not a supporter | 37% | 37% | 39% | 28% |
| (VOL) Don’t know | 8% | 5% | 9% | 6% |
| (n) | (540) | (514) | (681) | (521) |
METHODOLOGY
The Monmouth University Poll was sponsored and conducted by the Monmouth University Polling Institute from November 30 to December 4, 2023 with a probability-based national random sample of 540 registered voters who identify with or lean toward the Republican Party. Interviews were conducted in English, and included 178 live landline telephone interviews, 220 live cell phone interviews, and 142 online surveys via a cell phone text invitation. Telephone numbers were selected through a mix of random digit dialing and list-based sampling. Landline respondents were selected with a modified Troldahl-Carter youngest adult household screen. Interviewing services were provided by Braun Research, with sample obtained from Dynata (RDD, n= 229), Aristotle (list, n= 255) and a panel of prior Monmouth poll participants (n= 56). Monmouth is responsible for all aspects of the survey design, data weighting and analysis. The full sample is weighted for region, age, education, gender and race based on voter list and US Census information (ACS 2021 one-year survey). For results based on this sample, one can say with 95% confidence that the error attributable to sampling has a maximum margin of plus or minus 5.4 percentage points adjusted for sample design effects (1.67). Sampling error can be larger for sub-groups (see table below). In addition to sampling error, one should bear in mind that question wording and practical difficulties in conducting surveys can introduce error or bias into the findings of opinion polls.
Demographics (weighted)
Party (self-reported): 51% Strong Republican,18% Republican, not strong, 31% Independent, lean Rep
Sex: 53% Male, 47% Female
Age: 16% 18-34, 23% 35-49, 32% 50-64, 29% 65+
Race: 80% White, 12% Hispanic, 8% Black/Asian/Other
Education: 40% High school or less, 32% Some college, 15% 4 year degree, 13% graduate degree
Click on pdf file link below for full methodology and crosstabs by key demographic groups.


