West Long Branch, NJ – Most Americans continue to feel that the country is greatly divided on its core values and that it has become more divided since President Donald Trump took office. Few feel that it will become more united in the coming year, although Republicans are somewhat less negative than Democrats about the nation’s political rift. The Monmouth University Poll also finds that the public continues to feel that both the president and the major political parties are not giving enough attention to issues that Americans say affect them the most.
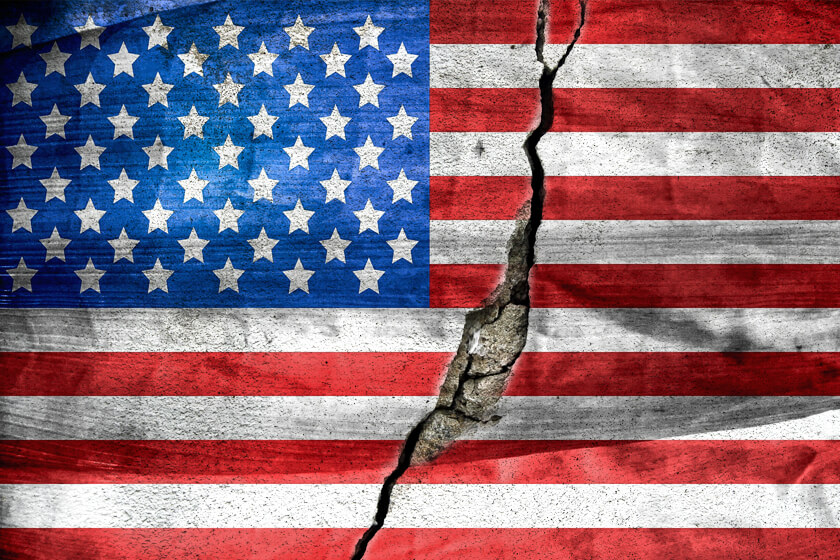
Just 20% of the public feels that Americans are united and in agreement on our most important values. More than 3-in-4 (77%) say we are not. Majorities of Democrats (82%), Republicans (78%), and independents (72%) feel that the country is fundamentally divided. These results are slightly more negative than in December 2017 when 72% said the nation was divided on its core values and 23% said the country was united.
More than 6-in-10 Americans (62%) feel that the country has become more divided since Trump took office. Just 11% say the country has become more united and 25% say there has not really been a change in our sense of unity. A plurality of Republicans (44%) join majorities of independents (59%) and Democrats (81%) in saying that the nation has become more divided since Trump took office. These results are virtually unchanged from a year ago.
Looking ahead, one-third (34%) of the public expects the country will become more divided in the coming year. Just 1-in-5 (21%) say it will become more united. A plurality of 40% feel that not much will change in America’s political divide over the next year. Republicans are split between saying that the country will become more divided (25%) or more united (28%) in the coming year, while there tends to be greater pessimism among Democrats (41% more divided to 17% more united) and independents (35% more divided to 19% more united).
“We just held a midterm election where record high turnout demonstrated that politics matters to people. But that doesn’t mean they are particularly optimistic about what the future might hold. Negative opinion of American politics has not budged at all over the past year,” said Patrick Murray, director of the independent Monmouth University Polling Institute.
The vast majority of Americans are either angry (19%) or dissatisfied (62%) with Washington. The current result is in line with polls conducted over the past two years, where between 79% and 86% of the public said they were either angry or dissatisfied. Only 12% are currently satisfied with the way things are going in “D.C.” today and just 3% are happy with Washington. Democrats (90%) and independents (83%) are somewhat more likely than Republicans (69%) to hold a negative view of Washington, but these results still represent sizable majorities of all partisan groups.
Just over half of the American public feels our system of government is basically sound, although only 10% say it essentially needs no changes, while another 42% say it is sound but could use some improvement. The poll finds that 26% say the American system is not too sound and needs many improvements and 22% say it is not sound at all and needs significant changes. It is worth noting that a poll taken by ORC right after the 1980 election found that more than 6-in-10 Americans (62%) felt then that the U.S. system of government was basically sound, which is ten points higher than the current Monmouth University Poll result of 52% saying it is sound.
The current national results are virtually unchanged from a year ago, but there have been some shifts among partisan groups. The number of Republicans who feel that the nation’s system of government is basically sound has grown from 60% last December to 68% in the current poll. Similarly, the number of independents who feel the system is basically sound has increased from 45% to 53%. On the other hand, Democrats’ faith in the American system has dropped over the past year, from 48% who said it was basically sound in 2017 to 37% now.
“There’s a pervading sense that unless your party is in charge, the system itself is broken. That’s not good for the long term health of our nation’s political institutions,” said Murray.
Most Americans feel that government is not paying attention to the issues that impact their family, but there is a decidedly partisan lens through which they judge the different players. Less than 4-in-10 (38%) say that Trump has been giving enough attention to issues that are most important to their families. A majority (56%) wish he would give these issues more attention. While 72% of Republicans say that Trump has been paying enough attention to their most important issues, just 37% of independents and 13% of Democrats agree. These results are in line with prior polls since Trump took office.
More than 6-in-10 Americans say that both political parties do not give enough attention to everyday economic issues that affect people like them – 64% for the Democratic Party and 63% for the Republican Party. Just 26% say the Democrats are paying the right amount of attention and 30% say the Republicans are paying the right amount of attention to these issues. These results are in line with the March 2017 Monmouth University Poll.
Majorities of Democrats (79%) and independents (64%) say the Republican Party is not giving these economic issues enough attention. Majorities of Republicans (81%) and independents (71%) say the Democratic Party is not giving these issues enough attention. Republicans are more positive about their own party (52% right amount and 41% not enough attention) and Democrats are more positive about their own party (49% right amount and 42% not enough attention). Still, about 4-in-10 partisan identifiers say that their own party does not pay enough attention to everyday economic issues that affect Americans.
Trump promised to “drain the swamp” when he got to Washington and 30% of the public currently feels he has made progress on that front. This is a slight improvement from polls taken over the past year and a half when between 20% and 25% of the public felt he was making headway on his swamp-draining pledge. However, another 30% say Trump has made the swamp worse, which remains in line with prior poll results that have ranged from 26% to 33%. One-third of the public (33%) say that nothing has really changed about the Washington quagmire since Trump took office.
The ten point increase in confidence that Trump is draining the swamp – 30% in the current poll compared to a low of 20% one year ago – has come from Republicans (66%, up from 47% in December 2017) and also from independents (27%, up from 14% in December 2017). Almost no Democrats share this view (4% in both the current poll and December 2017).
The Monmouth University Poll was conducted by telephone from November 9 to 12, 2018 with 802 adults in the United States. The question results in this release have a margin of error of +/- 3.5 percentage points. The poll was conducted by the Monmouth University Polling Institute in West Long Branch, NJ.
QUESTIONS AND RESULTS
(* Some columns may not add to 100% due to rounding.)
[Q1-11 previously released.]
12. Which statement comes closer to your view: Americans are united and in agreement about the most important values – or – Americans are greatly divided when it comes to the most important values? [CHOICES WERE ROTATED]
| TREND: | Nov. 2018 | Dec. 2017 | March 2017 | Aug. 2016* |
| Americans are united | 20% | 23% | 22% | 27% |
| Americans are greatly divided | 77% | 72% | 75% | 70% |
| (VOL) Don’t know | 4% | 5% | 4% | 4% |
| (n) | (802) | (806) | (801) | (803) |
* Registered voters
13. Has the country become more united, more divided, or not really changed since President Trump took office?
| TREND: | Nov. 2018 | Dec. 2017 | March 2017 |
| More united | 11% | 9% | 11% |
| More divided | 62% | 63% | 52% |
| Not really changed | 25% | 26% | 34% |
| (VOL) Don’t know | 3% | 2% | 3% |
| (n) | (802) | (806) | (801) |
14. Looking ahead to the next year, do you think the country will grow more united, more divided, or will not much change?
| Nov. 2018 | |
| More united | 21% |
| More divided | 34% |
| Not much change | 40% |
| (VOL) Don’t know | 5% |
| (n) | (802) |
15. Which of the following words best describes how you feel about Washington – angry, dissatisfied, satisfied, happy?
| TREND: | Nov. 2018 | March 2018 | Dec. 2017 | May 2017 | Sept. 2016* |
| Angry | 19% | 22% | 20% | 25% | 20% |
| Dissatisfied | 62% | 59% | 60% | 54% | 66% |
| Satisfied | 12% | 12% | 12% | 16% | 9% |
| Happy | 3% | 4% | 3% | 2% | 3% |
| (VOL) Don’t know | 3% | 3% | 6% | 2% | 2% |
| (n) | (802) | (803) | (806) | (1,002) | (802) |
* Registered voters
16. I’m going to read four statements about our American system of government. Listen carefully and then tell me which one is closest to how you feel: our system of government is basically sound and essentially needs no changes, our system is basically sound, but needs some improvement, our system is not too sound and needs many improvements, or our system is not sound at all and needs significant changes?
| TREND: | Nov. 2018 | Dec. 2017 |
| Basically sound, no changes | 10% | 7% |
| Basically sound, some improvement | 42% | 43% |
| Not too sound, many improvements | 26% | 25% |
| Not sound at all, significant changes | 22% | 24% |
| (VOL) Don’t know | 1% | 2% |
| (n) | (802) | (806) |
17. Donald Trump promised to “drain the swamp” when he got to Washington. Would you say that he has made progress draining the swamp, that he has made the swamp worse, or that nothing has really changed?
| TREND: | Nov. 2018 | April. 2018 | Dec. 2017 | Aug. 2017 | May 2017 |
| Made progress draining the swamp | 30% | 25% | 20% | 25% | 24% |
| Made the swamp worse | 30% | 31% | 33% | 26% | 32% |
| Nothing has really changed | 33% | 37% | 38% | 39% | 35% |
| (VOL) Don’t know | 6% | 7% | 9% | 10% | 8% |
| (n) | (802) | (803) | (806) | (805) | (1,002) |
18. Regardless of whether you agree or disagree with President Trump, has he been giving enough attention to the issues that are most important to your family or do you wish he would give more attention to issues that are important to your family?
| TREND: | Nov. 2018 | Sept. 2017 | Aug. 2017 | May 2017 | March 2017 |
| Giving enough attention | 38% | 37% | 40% | 34% | 36% |
| Wish he’d give more attention | 56% | 53% | 51% | 62% | 57% |
| (VOL) Don’t know | 6% | 10% | 9% | 5% | 7% |
| (n) | (802) | (1,009) | (805) | (1,002) | (801) |
[QUESTIONS 19 & 20 WERE ROTATED]
19. Does the Republican Party pay too much, the right amount, or not enough attention to everyday economic issues that affect people like you?
| TREND: | Nov. 2018 | March 2017 |
| Too much | 3% | 4% |
| Right amount | 30% | 28% |
| Not enough | 63% | 63% |
| (VOL) Don’t know | 4% | 4% |
| (n) | (802) | (801) |
20. Does the Democratic Party pay too much, the right amount, or not enough attention to everyday economic issues that affect people like you?
| TREND: | Nov. 2018 | March 2017 |
| Too much | 4% | 5% |
| Right amount | 26% | 25% |
| Not enough | 64% | 65% |
| (VOL) Don’t know | 6% | 5% |
| (n) | (802) | (801) |
[Q21-30 previously released.]
[Q31-42 held for future release.]
METHODOLOGY
The Monmouth University Poll was sponsored and conducted by the Monmouth University Polling Institute from November 9 to 12, 2018 with a national random sample of 802 adults age 18 and older, in English. This includes 398 contacted by a live interviewer on a landline telephone and 404 contacted by a live interviewer on a cell phone. Telephone numbers were selected through random digit dialing and landline respondents were selected with a modified Troldahl-Carter youngest adult household screen. Monmouth is responsible for all aspects of the survey design, data weighting and analysis. Final sample is weighted for region, age, education, gender and race based on US Census information. Data collection support provided by Braun Research (field) and SSI (RDD sample). For results based on this sample, one can say with 95% confidence that the error attributable to sampling has a maximum margin of plus or minus 3.5 percentage points (unadjusted for sample design). Sampling error can be larger for sub-groups (see table below). In addition to sampling error, one should bear in mind that question wording and practical difficulties in conducting surveys can introduce error or bias into the findings of opinion polls.
| DEMOGRAPHICS (weighted) |
|
Self-Reported |
| 28% Republican |
| 38% Independent |
| 34% Democrat |
| 49% Male |
| 51% Female |
| 31% 18-34 |
| 34% 35-54 |
| 36% 55+ |
| 64% White |
| 12% Black |
| 16% Hispanic |
|
8% Asian/Other |
| 68% No degree |
| 32% 4 year degree |
Click on pdf file link below for full methodology and results by key demographic groups.


