
West Long Branch, NJ – Racial and ethnic discrimination continues to be a big problem and is a significant reason for the country’s political divide according to a majority of Americans. The Monmouth (“Mon-muth”) University Poll also finds there is more public support for teaching about racial inequality in schools than there is for teaching about gender identity. However, there are stark partisan differences among white Americans in their views on teaching about either topic.
Eight in ten Americans say racial and ethnic discrimination is a problem in the United States, including 61% who say it is a big problem. Just 21% say it is not a problem. These results are basically in line with Monmouth’s polling during the past three years. This followed a spike in the number who said race discrimination was a big problem in early June 2020 (76%) when protests first broke out after the murder of George Floyd. Demographically, 76% of Black, Hispanic, Asian and other people of color see discrimination as a big problem, while 52% of non-Hispanic white Americans agree. However, there is a significant difference in this view among whites depending on whether they identify as Democrats (85%) or Republicans (31%).
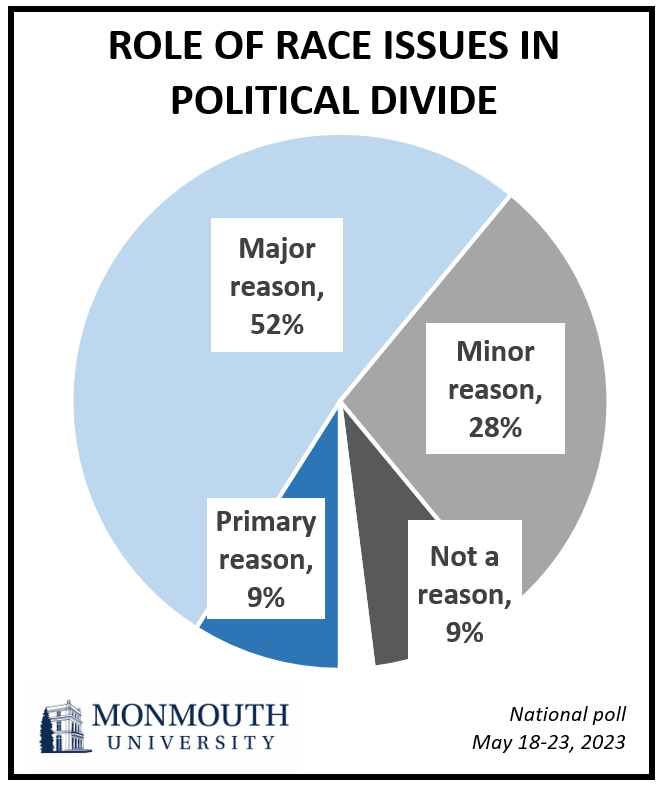
Six in 10 Americans say that issues around race relations in America are either the primary reason (9%) or a major reason (52%) for our current political divisions. Among people of color, 69% say race is a primary or major reason for our divisions. Among whites, this number is 57%, with a large gap between white Democrats (72%) and white Republicans (51%).
At the same time, most Americans remain nominally optimistic about the future of race relations, including 21% who are very hopeful and 52% who are somewhat hopeful. People of color (68%) are slightly less likely than whites (79%) to be hopeful about the future of race relations in America, although this opinion represents a majority among both groups. On this particular question, there is little difference between the views of white Democrats (76%) and white Republicans (79%).
“Most of the American public points to unresolved racial issues as being central to our current political tensions. There is hope that it will get better, but many people, particularly white Americans, are uneasy talking about these issues,” said Patrick Murray, director of the independent Monmouth University Polling Institute.
A majority (58%) of people of color say that given all the issues facing the country right now, racial diversity and inclusion should be given more attention. Just 28% of white Americans agree. In fact half (49%) of whites say racial diversity and inclusion should be given less attention while only 23% of people of color say the same. Focusing on how racial inequality is addressed in schools, white Americans are divided on being more supportive of limiting how racial inequality issues are taught (50%) or broadening how these issues are taught (45%). Among white Democrats, 54% say that race issues should be given more attention in general and 85% are supportive of broadening how race is taught in schools. By comparison, 75% of white Republicans say racial diversity and inclusion should be given less attention and 82% support limiting how racial inequality is taught.
The teaching of race as well as gender identity in schools have become hot button cultural issues in America. The poll finds 63% of the public says transgender and sexual identity issues should be given less attention – a number that is 24 points higher than the number who say racial diversity should be given less attention. Just 23% say gender identity should be getting more attention – which is 16 points lower than the same question about race. Turning to school curricula, just 35% tend to be more supportive of broadening how gender identity is taught in schools while a majority of 57% are more supportive of limiting how this issue is taught.
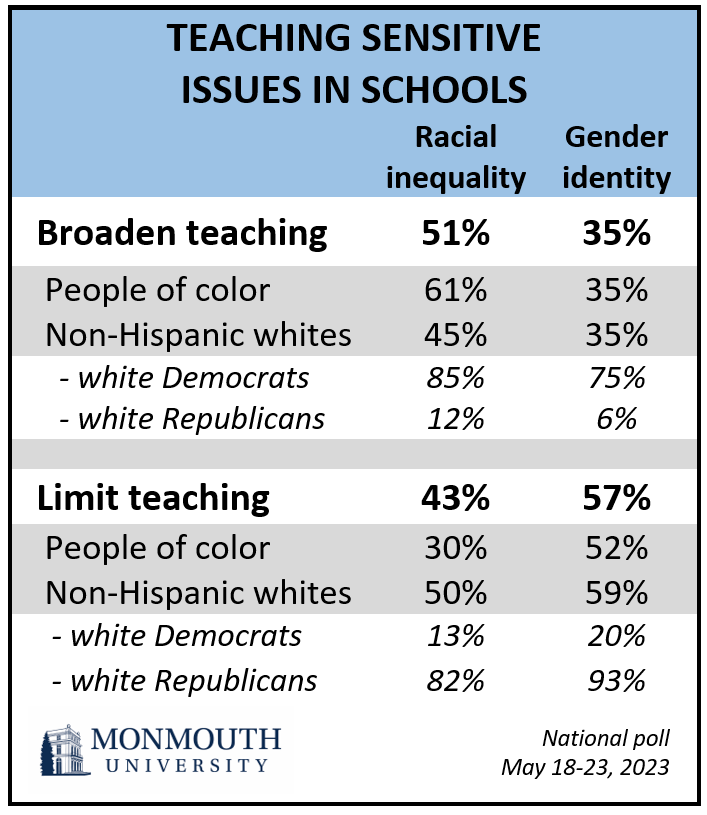
There are few differences in these results by race overall. Clear majorities of both whites (68%) and people of color (57%) say transgender and sexual identity issues should be given less attention. Similarly, both groups support limiting how gender identity is taught in schools (59% white and 52% people of color). As may be expected, white Republicans (93%) are much more likely than white Democrats (20%) to want to limit how gender identity is taught in schools. However, white Democrats (75%) are also significantly more likely than nonwhite Democrats (40%) to support broadening how gender is taught.
“Democrats of all races are basically on the same page when it comes to talking about the legacy of race in this country. They differ, however, when it comes to addressing gender identity, an issue where people of color tend to be more conservative in their views,” said Murray.
The Monmouth University Poll was conducted by telephone from May 18 to 23, 2023 with 981 adults in the United States. The question results in this release have a margin of error of +/- 5.6 percentage points for the full sample. The poll was conducted by the Monmouth University Polling Institute in West Long Branch, NJ.
QUESTIONS AND RESULTS
(* Some columns may not add to 100% due to rounding.)
[Q1-29 previously released.]
30.Do you think that racial and ethnic discrimination in the United States is a problem or not a problem? [If PROBLEM: Is it a big problem or a small problem?]
| Trend: | May 2023 | April 2021 | Nov. 2020 | Early Sept. 2020 | Late June 2020 | Early June 2020 | July 2016* | Jan. 2015 |
|---|---|---|---|---|---|---|---|---|
| Yes, big problem | 61% | 63% | 65% | 65% | 67% | 76% | 68% | 51% |
| Yes, small problem | 13% | 8% | 11% | 11% | 10% | 12% | 12% | 21% |
| Yes, but not sure if big or small | 5% | 8% | 4% | 5% | 4% | 4% | 7% | 9% |
| No, not a problem | 21% | 20% | 18% | 18% | 17% | 7% | 10% | 18% |
| (VOL) Don’t know | 1% | 1% | 1% | 1% | 1% | 0% | 3% | 1% |
| (n) | (981) | (800) | (810) | (867) | (867) | (759) | (805) | (1,003) |
*Registered voters
31.When thinking about the future of race relations in America, do you feel very hopeful, somewhat hopeful, not too hopeful, or not at all hopeful?
| Trend: | May 2023 | April 2021 | Early Sept. 2020 | Late June 2020 |
|---|---|---|---|---|
| Very hopeful | 21% | 23% | 29% | 26% |
| Somewhat hopeful | 52% | 48% | 54% | 56% |
| Not too hopeful | 16% | 17% | 9% | 10% |
| Not at all hopeful | 10% | 11% | 6% | 6% |
| (VOL) Don’t know | 1% | 1% | 2% | 2% |
| (n) | (981) | (800) | (867) | (867) |
32.How much of a role do issues around race relations in America play in our current political divisions? Are race issues the primary reason for our current political divisions, are they a major reason for our divisions but not the primary one, are they a minor reason for our divisions, or are they not a reason at all for our divisions?
| Response: | May 2023 |
|---|---|
| Primary reason | 9% |
| Major reason | 52% |
| Minor reason | 28% |
| Not a reason | 9% |
| (VOL) Don’t know | 2% |
| (n) | (981) |
33.Given all the issues facing the country right now, do you think the amount of attention currently being paid to racial diversity and inclusion is about right, should it be given less attention, or should it be given more attention?
| Response: | May 2023 |
|---|---|
| About right | 20% |
| Given less attention | 39% |
| Given more attention | 39% |
| (VOL) Don’t know | 3% |
| (n) | (981) |
34.And given all the issues facing the country right now, do you think the amount of attention currently being paid to transgender and sexual identity is about right, should it be given less attention, or should it be given more attention?
| Response: | May 2023 |
|---|---|
| About right | 11% |
| Given less attention | 63% |
| Given more attention | 23% |
| (VOL) Don’t know | 3% |
| (n) | (981) |
35.How closely have you been following recent debate over how gender identity and racial equality are being taught in schools – very closely, somewhat closely, or not closely?
| Response: | May 2023 |
|---|---|
| Very closely | 42% |
| Somewhat closely | 36% |
| Not closely | 23% |
| (n) | (981) |
[QUESTIONS 36 & 37 WERE ROTATED]
36.In general, do you tend to be more supportive of broadening how gender identity issues are taught in schools or more supportive of limiting how gender identity issues are taught in schools?
| Response: | May 2023 |
|---|---|
| More supportive of broadening | 35% |
| More supportive of limiting | 57% |
| (VOL) Don’t know | 8% |
| (n) | (981) |
37.In general, do you tend to be more supportive of broadening how racial inequality issues are taught in schools or more supportive of limiting how racial inequality issues are taught in schools?
| Response: | May 2023 |
|---|---|
| More supportive of broadening | 51% |
| More supportive of limiting | 43% |
| (VOL) Don’t know | 7% |
| (n) | (981) |
Methodology
The Monmouth University Poll was sponsored and conducted by the Monmouth University Polling Institute from May 18 to 23, 2023 with a probability-based national random sample of 981 adults age 18 and older. Interviews were conducted in English, and included 352 live landline telephone interviews, 512 live cell phone interviews, and 117 online surveys via a cell phone text invitation. Telephone numbers were selected through a mix of random digit dialing and list-based sampling. Landline respondents were selected with a modified Troldahl-Carter youngest adult household screen. Interviewing services were provided by Braun Research, with sample obtained from Dynata (RDD, n= 669), Aristotle (list, n= 140) and a panel of prior Monmouth poll participants (n= 172). Monmouth is responsible for all aspects of the survey design, data weighting and analysis. The full sample is weighted for region, age, education, gender and race based on US Census information (ACS 2021 one-year survey). For results based on this sample, one can say with 95% confidence that the error attributable to sampling has a maximum margin of plus or minus 5.6 percentage points adjusted for sample design effects (1.79). Sampling error can be larger for sub-groups (see table below). In addition to sampling error, one should bear in mind that question wording and practical difficulties in conducting surveys can introduce error or bias into the findings of opinion polls.
DEMOGRAPHICS (weighted) |
| Self-Reported |
| 26% Republican |
| 44% Independent |
| 30% Democrat |
| 49% Male |
| 51% Female |
| 29% 18-34 |
| 33% 35-54 |
| 38% 55+ |
| 61% White |
| 13% Black |
| 18% Hispanic |
| 8% Asian/Other |
| 67% No degree |
| 33% 4 year degree |
Click on pdf file link below for full methodology and crosstabs by key demographic groups.


