West Long Branch, NJ – The American public is almost evenly divided on President Donald Trump’s executive order on social media bias. About half think Twitter and Facebook handle content involving the president fairly, but some Democrats think these sites are likely to be too favorable toward Trump while many Republicans think they are too unfavorable. The Monmouth (“Mon-muth”) University Poll finds that a large majority approve of social media companies putting flags on possibly misleading posts, but few feel those platforms are currently doing a good job monitoring the content on their sites.
Trump’s executive order to look at ways social media sites can be held liable for bias in handling user content is supported by 45% of Americans – ranging from 76% of Republicans to 46% of independents and 16% of Democrats. Half (50%) of the public disapproves of the president’s order.
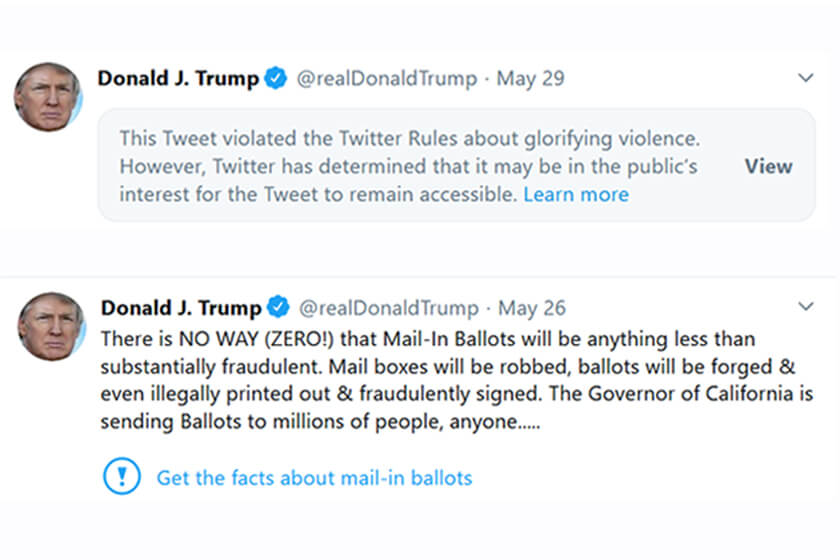
Seven in ten (70%) are aware that Twitter recently flagged a number of the president’s tweets. Just under half (46%) of Americans say this was a good idea on Twitter’s part and 26% say it was a bad idea. Another 28% say they are not sure. These results split on party lines – 73% good idea to 7% bad idea among Democrats, 47% good idea to 26% bad idea among independents, and 13% good idea to 49% bad idea among Republicans. Specifically among Twitter users in the American public, 60% say the company’s actions on Trump’s tweets was a good idea and 19% say it was a bad idea.
“Americans are divided on the president’s executive order, but more seem to side with the social media site on the larger issue of monitoring user content,” said Patrick Murray, director of the independent Monmouth University Polling Institute.
Two-thirds (66%) of Americans approve of social media sites like Facebook and Twitter flagging user posts for possible false or misleading content, although fewer (50%) approve of the companies actually deleting such posts. One-third (34%) approve of users being able to sue these sites for free speech violations if their posts are flagged as misleading. Approval of the ability to sue goes up to 42% if such a post is deleted. Of note, the poll did not find any significant shift in opinion on social media users’ ability to sue sites for flagging their posts when this question was asked again after mentioning Twitter’s actions on Trump’s tweets. Less than one-third (31%) of the public says that social media sites should be held liable for the content posted by their users. Democrats are more likely than Republicans and independents to approve of social media platforms flagging or deleting misleading posts and are less likely to support users being able to sue platforms for flagging or deleting those posts.
In general, just 29% of Americans feel that Twitter does a good job monitoring the content of what people post on its site, while 45% say it does a bad job and 26% say they don’t know. Opinion on Facebook’s monitoring of its contents is more negative overall at 32% good job and 59% bad job with 10% saying they don’t know. There is a split on why people think the platforms are doing a bad job – 25% say Facebook’s monitoring goes too far and 31% say it does not go far enough, while 15% say Twitter’s monitoring goes too far and 27% say it does not go far enough. There are few partisan differences in the total number who say these sites are doing a bad job monitoring content. However, Democrats are more likely to say the sites are doing a bad job because they are not going far enough (49% for Facebook and 42% for Twitter), while Republicans are more likely to say they are doing a bad job because they are going too far (37% for Facebook and 24% for Twitter).
“Democrats want to see more social media content flagged while Republicans want to see less,” said Murray.
When asked specifically about how the two platforms handle content involving President Trump, 48% say Facebook is generally fair and 46% say Twitter is generally fair. Most Democrats feel the sites treat Trump-related content fairly (60% for Facebook and 63% for Twitter), while few Republicans feel the same (28% for Facebook and 24% for Twitter). Just under 4 in 10 Americans say Facebook (39%) and Twitter (37%) are generally unfair in how they handle content involving the president. Those who say the sites’ treatment is unfair are more likely to describe it as too unfavorable (27% for Facebook and 25% for Twitter) rather than too favorable (9% for Facebook and 9% for Twitter) toward Trump.
The Monmouth University Poll also finds that 1 in 5 (20%) Americans say social media sites like Facebook, YouTube, and Twitter are mostly responsible for the spread of fake news today. Another 61% say they are partly responsible but other media sources are more responsible and 14% say they are not responsible for the spread of fake news at all. However, two-thirds (68%) of the public feels that outside groups trying plant fake news stories on social media sites poses a serious problem. Another 16% say this is happening but it is not a serious problem and 10% say it is not happening. There are few partisan differences in these opinions and the overall results are similar to a Monmouth poll taken two years ago.
Just 26% feel that social media sites are doing enough to stop the spread of fake news on their sites while 64% say they are not doing enough. About one-third of Republicans (29%) and independents (33%) say these sites are doing enough, while about half that number of Democrats (16%) agree. In 2018, a similar 20% said these sites were doing enough and 69% said they were not.
Two-thirds (67%) of the public reports using Facebook and 28% reports using Twitter. Just 3 in 10 (29%) Americans do not use either site. Nearly all Twitter users also use the Facebook platform, but less than 4 in 10 Facebook users report having a Twitter account as well. Similar numbers of Democrats (68%), independents (68%), and Republicans (64%) use Facebook. Democrats (32%) and independents (32%), though, are somewhat more likely than Republicans (20%) to use Twitter.
The Monmouth University Poll was conducted by telephone from May 28 to June 1, 2020 with 807 adults in the United States. The question results in this release have a margin of error of +/- 3.5 percentage points. The poll was conducted by the Monmouth University Polling Institute in West Long Branch, NJ.
QUESTIONS AND RESULTS
(* Some columns may not add to 100% due to rounding.)
[Q1-3, Q11-18, Q28-39 & B1-B10 previously released.]
[Q4-10 & Q19-27 held for future release.]
40. Do you currently use the social media platforms Facebook or Twitter, or not? [If YES: Which?]
| June 2020 | |
| Yes, Facebook | 43% |
| Yes, Twitter | 4% |
| Yes, both | 24% |
| No, do not use either | 29% |
| (VOL) Don’t know | 0% |
| (n) | (807) |
41. How often do you use Facebook or Twitter to read items posted by other users – every day, a few times a week, a few times a month, or less often?
| June 2020 | |
| Every day | 49% |
| Few times a week | 15% |
| Few times a month | 3% |
| Less often | 4% |
| Do not use either (from Q40) | 29% |
| (n) | (807) |
[QUESTIONS 42 & 43 WERE ROTATED]
42. Based on what you know or have heard, does Facebook do a good job or bad job monitoring the content of what people post on it? [If BAD JOB: Does Facebook’s monitoring go too far or not far enough?]
| June 2020 | |
| Good job | 32% |
| Bad job, too far | 25% |
| Bad job, not far enough | 31% |
| (VOL) Bad job, not sure | 3% |
| (VOL) Don’t know | 10% |
| (n) | (807) |
43. Based on what you know or have heard, does Twitter do a good job or bad job monitoring the content of what people post on it? [If BAD JOB: Does Twitter’s monitoring go too far or not far enough?]
| June 2020 | |
| Good job | 29% |
| Bad job, too far | 15% |
| Bad job, not far enough | 27% |
| (VOL) Bad job, not sure | 3% |
| (VOL) Don’t know | 26% |
| (n) | (807) |
[QUESTIONS 44 & 45 WERE ROTATED]
44. Do you approve or disapprove of social media sites like Facebook and Twitter putting a flag or label on user posts for possible false or misleading content?
| June 2020 | |
| Approve | 66% |
| Disapprove | 28% |
| (VOL) Don’t know | 6% |
| (n) | (807) |
45. Do you approve or disapprove of social media sites like Facebook and Twitter deleting user posts for possible false or misleading content?
| June 2020 | |
| Approve | 50% |
| Disapprove | 45% |
| (VOL) Don’t know | 5% |
| (n) | (807) |
46. Do you approve or disapprove of holding social media sites like Facebook and Twitter liable, meaning they can be sued, for the content its users post on their sites?
| June 2020 | |
| Approve | 31% |
| Disapprove | 63% |
| (VOL) Don’t know | 6% |
| (n) | (807) |
[QUESTIONS 47 & 48 WERE ROTATED]
47. Do you approve or disapprove of allowing users to sue social media sites like Facebook and Twitter for free speech violations if the sites flag or label their posts as false or misleading?
| June 2020 | |
| Approve | 34% |
| Disapprove | 60% |
| (VOL) Don’t know | 7% |
| (n) | (807) |
48. Do you approve or disapprove of allowing users to sue social media sites like Facebook and Twitter for free speech violations if the sites delete their posts because they might be false or misleading?
| June 2020 | |
| Approve | 42% |
| Disapprove | 53% |
| (VOL) Don’t know | 5% |
| (n) | (807) |
[QUESTIONS 49 & 50 WERE ROTATED]
49. Do you think the way Facebook handles content involving President Trump is generally fair or unfair? [If UNFAIR: Does Facebook tend to be too favorable or too unfavorable toward Trump?]
| June 2020 | |
| Fair | 48% |
| Unfair, too favorable | 9% |
| Unfair, too unfavorable | 27% |
| (VOL) Unfair, not sure | 3% |
| (VOL) Don’t know | 13% |
| (n) | (807) |
50. Do you think the way Twitter handles content involving President Trump is generally fair or unfair? [If UNFAIR: Does Twitter tend to be too favorable or too unfavorable toward Trump?]
| June 2020 | |
| Fair | 46% |
| Unfair, too favorable | 9% |
| Unfair, too unfavorable | 25% |
| (VOL) Unfair, not sure | 3% |
| (VOL) Don’t know | 17% |
| (n) | (807) |
51. Did you hear that Twitter recently put flags on some of President Trump’s tweets including warning about the potential violation of Twitter policy and a link advising readers to get the facts about an issue, or did you not hear about this?
| June 2020 | |
| Yes, heard | 70% |
| No, not heard | 29% |
| (VOL) Don’t know | 1% |
| (n) | (807) |
52. Do you think it was a good idea or bad idea for Twitter to take this action on Trump’s tweets, or are you not sure?
| June 2020 | |
| Good idea | 46% |
| Bad idea | 26% |
| Not sure | 28% |
| (n) | (807) |
53. Knowing about this action on Trump’s tweets, do you approve or disapprove of allowing users to sue social media sites like Facebook and Twitter for free speech violations if the sites flag or label their posts as false or misleading?
| June 2020 | |
| Approve | 34% |
| Disapprove | 58% |
| (VOL) Don’t know | 8% |
| (n) | (807) |
54. President Trump recently signed an executive order to look at ways that social media sites can be held liable if they show bias in how they handle user content. Do you approve or disapprove of this action?
| June 2020 | |
| Approve | 45% |
| Disapprove | 50% |
| (VOL) Don’t know | 5% |
| (n) | (807) |
55. Do you think outside groups or agents are actively trying to plant fake news stories on social media sites like Facebook, Twitter, and YouTube, or is this not happening? [If YES: Is this a serious or not too serious problem?]
| TREND: | June 2020 | March 2018* |
| Yes, serious problem | 68% | 71% |
| Yes, not too serious | 16% | 16% |
| No, not happening | 10% | 7% |
| (VOL) Don’t know | 6% | 7% |
| (n) | (807) | (803) |
* March ’18 poll did not include “Twitter” in the question.
56. How much are social media sites like Facebook, Twitter, and YouTube responsible for the spread of fake news – are they mostly responsible, are they partly responsible but other media sources are more responsible, or are they not at all responsible?
| TREND: | June 2020 | March 2018* |
| Mostly responsible | 20% | 29% |
| Partly responsible but other media sources are more responsible | 61% | 60% |
| Not at all responsible | 14% | 6% |
| (VOL) Don’t know | 4% | 5% |
| (n) | (807) | (803) |
* March ’18 poll did not include “Twitter” in the question.
57. Are social media sites like Facebook, Twitter and YouTube currently doing enough or not doing enough to stop the spread of fake news on their sites?
| TREND: | June 2020 | March 2018* |
| Doing enough | 26% | 20% |
| Not doing enough | 64% | 69% |
| (VOL) Don’t know | 10% | 11% |
| (n) | (807) | (803) |
* March ’18 poll did not include “Twitter” in the question.
METHODOLOGY
The Monmouth University Poll was sponsored and conducted by the Monmouth University Polling Institute from May 28 to June 1, 2020 with a national random sample of 807 adults age 18 and older. This includes 279 contacted by a live interviewer on a landline telephone and 528 contacted by a live interviewer on a cell phone, in English. Telephone numbers were selected through random digit dialing and landline respondents were selected with a modified Troldahl-Carter youngest adult household screen. Monmouth is responsible for all aspects of the survey design, data weighting and analysis. The full sample is weighted for region, age, education, gender and race based on US Census information (ACS 2018 one-year survey). Data collection support provided by Braun Research (field) and Dynata (RDD sample). For results based on this sample, one can say with 95% confidence that the error attributable to sampling has a maximum margin of plus or minus 3.5 percentage points (unadjusted for sample design). Sampling error can be larger for sub-groups (see table below). In addition to sampling error, one should bear in mind that question wording and practical difficulties in conducting surveys can introduce error or bias into the findings of opinion polls.
| DEMOGRAPHICS (weighted) |
| Self-Reported |
| 27% Republican |
| 41% Independent |
| 31% Democrat |
| 49% Male |
| 51% Female |
| 30% 18-34 |
| 33% 35-54 |
| 36% 55+ |
| 64% White |
| 12% Black |
| 16% Hispanic |
| 8% Asian/Other |
| 69% No degree |
| 31% 4 year degree |
Click on pdf file link below for full methodology and crosstabs by key demographic groups.


