West Long Branch, NJ – The leak of a draft decision overturning Roe v. Wade coincides with a growing polarization in public opinion of the U.S. Supreme Court. The Monmouth (“Mon-muth”) University Poll also finds stable majority support for legal access to abortion and letting the Roe precedent stand. Public expectations are that reversing this decision would lead to a bifurcated system of abortion laws, with residents of blue states expecting their states to protect abortion access and residents of red states expecting their states to ban or severely restrict abortion. A majority of the public would be very upset if laws banning abortion also included felony murder charges for the woman or her doctor.
Public opinion of the Supreme Court has grown negative since the leak of a pending decision to overturn Roe. More than half (52%) of Americans currently disapprove of the job the court is doing while just 38% approve. Two months ago, the court had an evenly divided rating of 42% approve to 42% disapprove. Disapproval of the Supreme Court’s job performance has jumped among both Democrats (from 54% in March to 75% now) and independents (from 37% to 57%).
At the same time, the court’s approval rating has actually improved among Republicans (from 52% in March to 65% now). The partisan gap in Supreme Court approval now stands at more than 50 points – 65% approval among Republicans compared with just 12% among Democrats. This gap stood at a much lower 21 points just two months ago (52% of Republicans and 31% of Democrats approved). In the last year of the Obama presidency, the partisan approval gap was 29 points – with Democrats (65%) being more positive than Republicans (36%).
“Recent public opinion of the Supreme Court has not been immune to political tribalism, but it was not nearly as polarized as other institutions. With news of a pending reversal of Roe, though, the court is now seen through the same stark partisan lens as other political players in Washington,” said Patrick Murray, director of the independent Monmouth University Polling Institute.
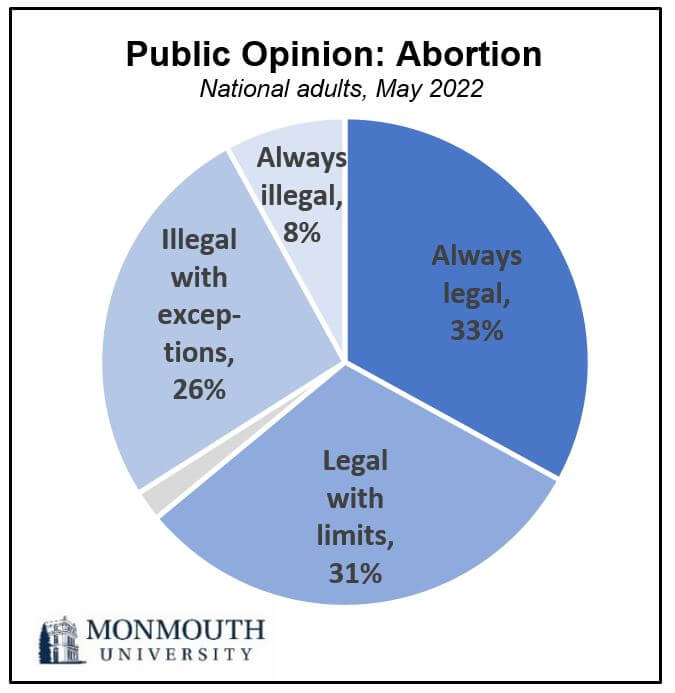
Americans’ views of abortion access have remained stable. More than 6 in 10 Americans support keeping the procedure legal – either always legal (33%) or with some limitations (31%). Another 26% say it should be illegal except for rape, incest or to save the mother’s life and 8% say it should always be illegal. Nearly 6 in 10 Americans (57%) say the Roe v. Wade precedent should be left as it is while 36% want the Supreme Court to revisit the case. The number who want to revisit the case has gone up slightly since September (31%), with Republicans and independents being more likely to want to revisit it and Democrats being slightly less likely.
If Roe is overturned, less than half (44%) of the public would like Congress to pass a law allowing abortion nationwide, but only 9% actually want a national ban. Another 43% prefer to leave abortion law up to the states. Most Democrats (75%) want a national law allowing abortion and most Republicans (63%) want to leave abortion law to the states.
A little less than half (45%) of Americans believe that their own state would be likely to allow unrestricted access to abortion through at least the first trimester if Roe is overturned. Another 20% think their state would impose significant limits on abortion and 24% believe their state would completely ban the procedure. Views on these possible outcomes differ mainly based on where people live. Close to two-thirds (64%) of blue state residents – states that voted for Joe Biden in the 2020 presidential election – think their state will be likely to allow abortion access through at least the first trimester. In red states – those that voted for Donald Trump – nearly half (47%) think their state will probably ban abortion completely and 27% think their state will place significant limits on abortion access.
Without the Roe precedent guiding abortion law, most Americans believe at least one-fifth of all U.S. states will completely ban abortions – 28% say between 11 and 20 states will do this and 41% say this number will be more than 20. In addition, 4 in 10 Americans (40%) believe that at least one-fifth of the states will treat illegal abortions as a felony where the woman or her doctor could be charged with murder.
“Some state legislatures are already making moves to add felony murder charges to pending abortion restrictions. It is not a scenario most Americans are comfortable with,” said Murray.
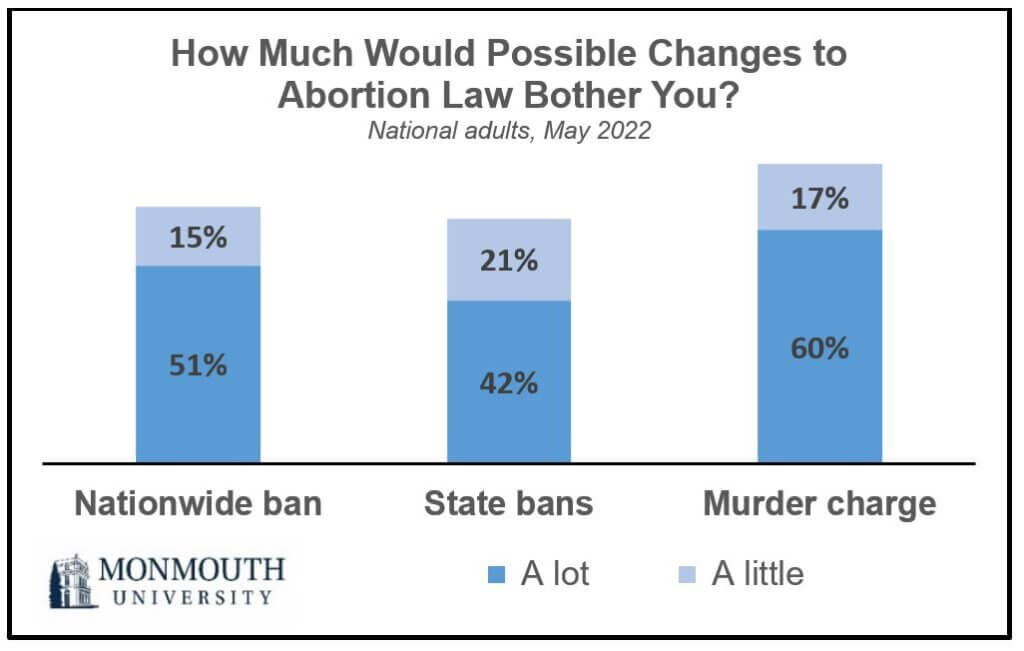
Half (51%) of Americans would be bothered a lot if abortion was banned nationwide and about 4 in 10 (42%) would feel the same if certain states banned it. However, 6 in 10 (60%) would be bothered a lot if U.S. states treated illegal abortions as a felony with the possibility of murder charges for the woman or her doctor.
Nearly all Democrats (89%) and a majority of independents (61%) would be bothered a lot if an illegal abortion resulted in a murder charge. Among Republicans, 35% would be bothered a lot, 27% would be bothered a little, and 37% would not be bothered at all by this consequence. In general, women are more likely than men to be bothered a lot by these outcomes, but this finding is due mainly to the fact that women are more likely to be Democrats. There are few gender differences on abortion opinion within partisan groups. One exception is the potential for abortion law to include murder charges – 41% of women who are Republican or lean toward the GOP would be bothered a lot by this type of law compared with fewer (26%) Republican men who would feel the same. Younger adults under the age of 35, who tend more than others toward seeing themselves as independents, are more likely than older Americans to be bothered by these possible outcomes, especially the prospect of a nationwide abortion ban.
The poll also asked about the direct impact of Roe being overturned. Only 3 in 10 Americans say individual states being able to ban or restrict abortion would personally impact them or their family – 15% say it would impact them a great deal and 14% say somewhat. On the other hand, over half (53%) feel they will not be impacted at all and another 16% do not expect much impact. Women (36%) are more likely than men (23%) to say they and their family will be impacted by these changes. This gender difference is found among both Democrats and Republicans.
Half the public says it is either very (26%) or somewhat (24%) likely that the Supreme Court will also overturn its decision that legalized same-sex marriage nationwide. A greater number of Democrats (71%) than Republicans (38%) feel this decision is also likely to be reversed, if Roe is overturned.
“Democrats are up in arms about the possibility of overturning Roe, but it is not yet clear how deep these emotions run beyond the active base. Will people who say this decision doesn’t directly affect them be spurred to action? The answer may depend in part on whether they fear overturning Roe will cause other dominoes to fall,” said Murray.
When asked about the amount of effort Washington politicians devote to abortion issues, 46% say Republican politicians spend too much effort, 21% say they give too little, and 29% say they devote the right amount of effort to abortion issues. These results are similar to Monmouth’s June 2019 poll, with the number who say Republicans are devoting the right amount having increased by 7 points.
Turning to the other party, 40% say Democratic politicians in Washington devote too much effort to abortion issues, 34% say they do not give enough effort to these issues, and 22% say they give the right amount of effort. These results are also similar to 2019, but with a 7 point increase among those saying the party is not doing enough. Among those who identify as Democrats themselves, 50% currently say politicians from their party are not devoting enough attention to abortion issues – up from 34% who said the same three years ago.
The Monmouth University Poll was conducted by telephone from May 5 to 9, 2022 with 807 adults in the United States. The question results in this release have a margin of error of +/- 3.5 percentage points. The poll was conducted by the Monmouth University Polling Institute in West Long Branch, NJ.
QUESTIONS AND RESULTS
(* Some columns may not add to 100% due to rounding.)
[Q1-8 held for future release.]
9.Do you approve or disapprove of the job the U.S. Supreme Court is doing?
| TREND: | May 2022 | March 2022 | Sept. 2021 | March 2016 |
| Approve | 38% | 42% | 42% | 49% |
| Disapprove | 52% | 42% | 45% | 33% |
| (VOL) Don’t know | 10% | 16% | 12% | 17% |
| (n) | (807) | (809) | (802) | (1,008) |
10.Which comes closest to your view on abortion: it should always be legal, it should be legal with some limitations, it should be illegal except for rape, incest or to save the mother’s life, or it should always be illegal?
| TREND: | May 2022 | Sept. 2021 | June 2019 |
| Always legal | 33% | 33% | 32% |
| Legal with limitations | 31% | 29% | 31% |
| Illegal with exceptions | 26% | 24% | 24% |
| Always illegal | 8% | 11% | 10% |
| (VOL) Don’t know | 2% | 2% | 3% |
| (n) | (807) | (802) | (751) |
11.The Roe versus Wade decision has guided abortion law in the United States since 1973. Would you like to see the Supreme Court revisit that decision or leave it as is?
| TREND: | May 2022 | Sept. 2021 |
| Revisit | 36% | 31% |
| Leave as is | 57% | 62% |
| (VOL) Don’t know | 7% | 7% |
| (n) | (807) | (802) |
Recent news reports suggest the Supreme Court might completely overturn the Roe versus Wade decision soon…
12.If Roe is overturned and individual states are allowed to make their own laws banning or restricting abortions, how much do you think it will personally impact you and your family – a great deal, some, not much, or not at all?
| May 2022 | |
| A great deal | 15% |
| Some | 14% |
| Not much | 16% |
| Not at all | 53% |
| (VOL) Don’t know | 2% |
| (n) | (807) |
13.If Roe is overturned, what would you like to see Congress do – pass a law allowing abortions nationwide, pass a law banning abortions nationwide, or leave abortion law up to the individual states?
| May 2022 | |
| Pass law allowing | 44% |
| Pass law banning | 9% |
| Leave up to the states | 43% |
| (VOL) Don’t know | 3% |
| (n) | (807) |
14.If Roe is overturned, what is most likely to happen in your own state? Is your state likely to ban abortion completely, likely to place significant limits on abortion access, or likely to allow unrestricted access to abortion through at least the first three months of pregnancy?
| May 2022 | |
| Ban completely | 24% |
| Significant limits | 20% |
| Unrestricted through 1st trimester | 45% |
| (VOL) Don’t know | 11% |
| (n) | (807) |
15.If Roe is overturned, how many U.S. states do you think will completely ban abortions – none of them, less than 5, between 5 and 10, between 11 and 20, or more than 20?
| May 2022 | |
| None of them | 4% |
| Less than 5 | 5% |
| Between 5 and 10 | 17% |
| Between 11 and 20 | 28% |
| More than 20 | 41% |
| (VOL) Don’t know | 5% |
| (n) | (807) |
16.If Roe is overturned, how many U.S. states do you think will treat illegal abortions as a felony where the woman or her doctor could be charged with murder – none of them, less than 5, between 5 and 10, between 11 and 20, or more than 20?
| May 2022 | |
| None of them | 9% |
| Less than 5 | 18% |
| Between 5 and 10 | 26% |
| Between 11 and 20 | 18% |
| More than 20 | 22% |
| (VOL) Don’t know | 7% |
| (n) | (807) |
17.How much would it bother you if abortion was banned nationwide – a lot, a little, or not at all?
| May 2022 | |
| A lot | 51% |
| A little | 15% |
| Not at all | 33% |
| (VOL) Don’t know | 1% |
| (n) | (807) |
18.How much would it bother you if abortion was banned in certain states – a lot, a little, or not at all?
| May 2022 | |
| A lot | 42% |
| A little | 21% |
| Not at all | 37% |
| (VOL) Don’t know | 0% |
| (n) | (807) |
19.How much would it bother you if U.S. states treated illegal abortions as a felony where the woman or her doctor could be charged with murder – a lot, a little, or not at all?
| May 2022 | |
| A lot | 60% |
| A little | 17% |
| Not at all | 21% |
| (VOL) Don’t know | 1% |
| (n) | (807) |
20.If Roe is overturned, how likely is it that the Supreme Court decision allowing same-sex marriage will also be overturned in the future – very likely, somewhat likely, not too likely, or not at all likely?
| May 2022 | |
| Very likely | 26% |
| Somewhat likely | 24% |
| Not too likely | 14% |
| Not at all likely | 32% |
| (VOL) Don’t know | 4% |
| (n) | (807) |
[QUESTIONS 21 & 22 WERE ROTATED]
Considering everything that the federal government is responsible for…
21.Are Republican politicians in Washington devoting too much effort on abortion issues, not enough effort, or the right amount?
| TREND: | May 2022 | June 2019 |
| Too much effort | 46% | 49% |
| Not enough effort | 21% | 20% |
| Right amount | 29% | 22% |
| (VOL) Don’t know | 4% | 10% |
| (n) | (807) | (751) |
22.Are Democratic politicians in Washington devoting too much effort on abortion issues, not enough effort, or the right amount?
| TREND: | May 2022 | June 2019 |
| Too much effort | 40% | 39% |
| Not enough effort | 34% | 27% |
| Right amount | 22% | 24% |
| (VOL) Don’t know | 4% | 9% |
| (n) | (807) | (751) |
[Q23-38 held for future release.]
METHODOLOGY
The Monmouth University Poll was sponsored and conducted by the Monmouth University Polling Institute from May 5 to 9, 2022 with a probability-based national random sample of 807 adults age 18 and older. This includes 284 contacted by a live interviewer on a landline telephone and 523 contacted by a live interviewer on a cell phone, in English. Telephone numbers were selected through a mix of random digit dialing and list-based sampling. Landline respondents were selected with a modified Troldahl-Carter youngest adult household screen. Interviewing services were provided by Braun Research, with sample obtained from Dynata (RDD, n=532), Aristotle (list, n=137) and a panel of prior Monmouth poll participants (n=138). Monmouth is responsible for all aspects of the survey design, data weighting and analysis. The full sample is weighted for region, age, education, gender and race based on US Census information (ACS 2018 one-year survey). For results based on this sample, one can say with 95% confidence that the error attributable to sampling has a maximum margin of plus or minus 3.5 percentage points (unadjusted for sample design). Sampling error can be larger for sub-groups (see table below). In addition to sampling error, one should bear in mind that question wording and practical difficulties in conducting surveys can introduce error or bias into the findings of opinion polls.
DEMOGRAPHICS (weighted) |
| Self-Reported |
| 30% Republican |
| 43% Independent |
| 27% Democrat |
| 49% Male |
| 51% Female |
| 30% 18-34 |
| 32% 35-54 |
| 38% 55+ |
| 63% White |
| 12% Black |
| 17% Hispanic |
| 8% Asian/Other |
| 69% No degree |
| 31% 4 year degree |
Click on pdf file link below for full methodology and crosstabs by key demographic groups.


