West Long Branch, NJ – Support for Covid-19 face-mask and social distancing guidelines has dropped from half of the public to just a third in the past two months as a large majority of Americans endorse the C.D.C. relaxing its recommendations. At the same time, a little under half of the public backs workplace vaccine mandates, a number that has not moved since January. The latest Monmouth (“Mon-muth”) University Poll also finds waning concern about family members becoming ill from the virus at the same time as more people report testing positive for Covid sometime during the pandemic.
More than 3 in 4 Americans (77%) endorse the C.D.C. relaxing its face mask and social distancing recommendations in areas with low Covid rates. Just 34% of the public supports instituting or reinstituting face mask and social distancing guidelines in their state at the current time, which is down significantly from 52% in January. At the same time, support for requiring people to show proof of vaccination in order to work in an office or around people has held steady – 44% now and 43% in January. A majority of Democrats continue to back vaccine (69%) and mask (60%) mandates, while at the same time saying they support the C.D.C. relaxing its Covid guidance (67%).
Regardless of where they stand now, half of the American public (50%) would prefer to see the government continue to adjust Covid guidelines and mandates in response to different variants as they arise. Another 14% want to settle on a consistent set of protocols from this point forward and 34% want to do away with all Covid regulations and mandates. Most Democrats want to maintain flexibility (82%) while most Republicans want to do away with all Covid regulations (67%).
Overall, 73% of Americans agree with the sentiment that “it’s time we accept that Covid is here to stay and we just need to get on with our lives” – which is similar to 70% who felt this way in January. Within this group who want to move on, identical numbers actually prefer adjusting Covid guidelines in response to new variants (42%) as say they want no regulations at all (42%). Another 14% of those who say it is time to get on with life want to choose a consistent set of guidelines.
“We asked the same question about accepting Covid is here to stay two months ago and got a similarly high number who want to get on with life. Our working hypothesis was that many people who support mandates simply wanted consistency in the guidelines. This new data suggests that is not necessarily the case. For some Americans, getting on with life means constantly being on guard and ready to reinstitute restrictions as new situations emerge,” said Patrick Murray, director of the independent Monmouth University Polling Institute.
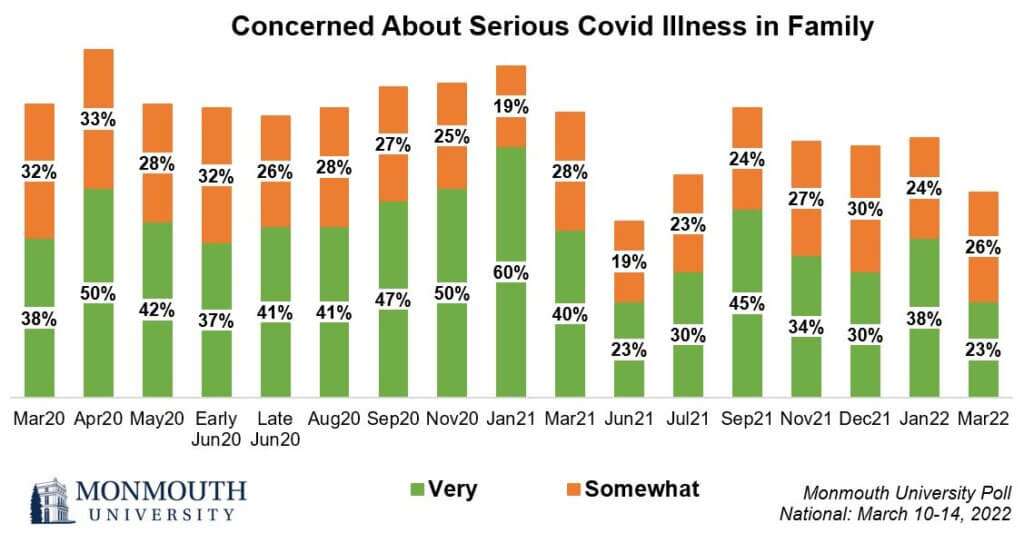
The number of people who are very concerned about a family member becoming seriously ill from the virus (23%) has dropped to its lowest point since last June (also 23%). This marks a 15-point decrease over the past two months (38% in January). The biggest drop in this concern has occurred among Democrats (30% now compared with 61% two months ago). At the same time, 38% of American adults report having tested positive for Covid (up from 27% in January). Another 14% say they were diagnosed without a test or believe they had the disease at some point during the pandemic.
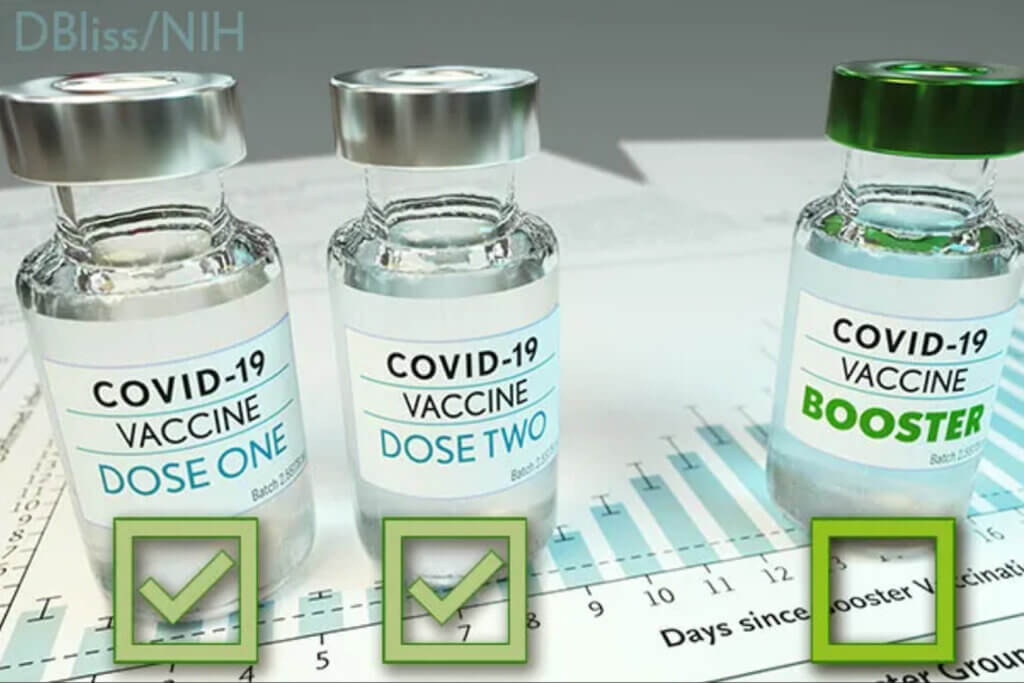
Vaccine uptake, particularly getting a booster shot, has stalled and the poll finds the rate is unlikely to improve by much. Currently, just under half (48%) of adults report having received a Covid booster dose while one-third (33%) say they are not at all likely to get it.
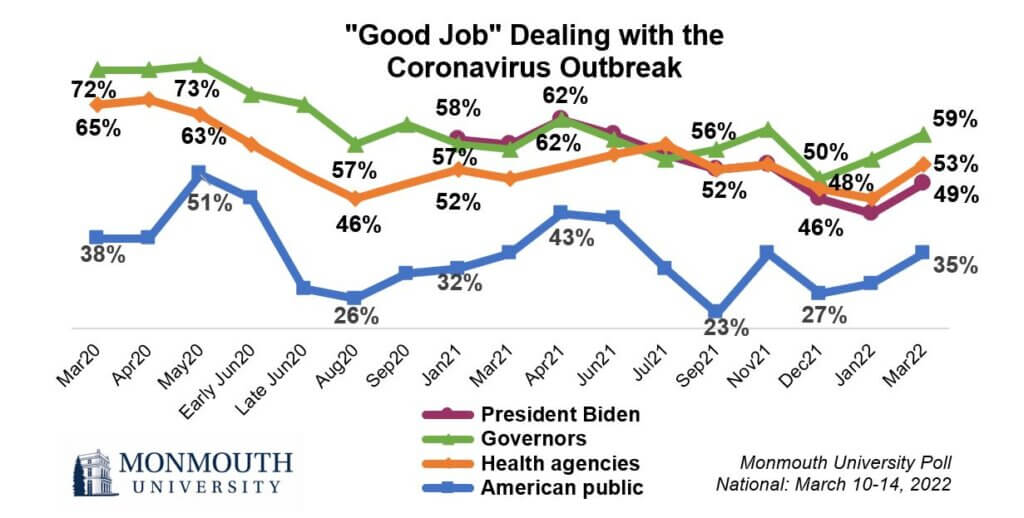
Ratings for how different groups in the country have been handling the pandemic have ticked up over the past two months, including for President Joe Biden (49% good job, up from 43% in January), federal health agencies (53%, up from 46%), state governors (59%, up from 54%), and the American public (35%, up from 29%).
The Monmouth University Poll was conducted by telephone from March 10 to 14, 2022 with 809 adults in the United States. The question results in this release have a margin of error of +/- 3.5 percentage points. The poll was conducted by the Monmouth University Polling Institute in West Long Branch, NJ.
QUESTIONS AND RESULTS
(* Some columns may not add to 100% due to rounding.)
[Q1-18 & Q20-29 previously released.]
[Q19 held.]
30.How concerned are you about someone in your family becoming seriously ill from the coronavirus outbreak – very concerned, somewhat concerned, not too concerned, or not at all concerned?
| TREND: | March 2022 | Jan. 2022 | Dec. 2021 | Nov. 2021 | Sept. 2021 | July 2021 | June 2021 | March 2021 | Jan. 2021 |
| Very concerned | 23% | 38% | 30% | 34% | 45% | 30% | 23% | 40% | 60% |
| Somewhat concerned | 26% | 24% | 30% | 27% | 24% | 23% | 19% | 28% | 19% |
| Not too concerned | 26% | 19% | 20% | 22% | 17% | 21% | 24% | 14% | 12% |
| Not at all concerned | 24% | 17% | 19% | 15% | 12% | 24% | 32% | 16% | 7% |
| (VOL) Don’t know | 0% | 0% | 0% | 1% | 1% | 0% | 1% | 0% | 0% |
| (VOL) Has already happened | 1% | 1% | 1% | 1% | 1% | 2% | 1% | 2% | 2% |
| (n) | (809) | (794) | (808) | (811) | (802) | (804) | (810) | (802) | (809) |
| TREND: Continued | Nov. 2020 | Early Sept. 2020 | Aug. 2020 | Late June 2020 | Early June 2020 | May 2020 | April 2020 | March 2020 |
| Very concerned | 50% | 47% | 41% | 41% | 37% | 42% | 50% | 38% |
| Somewhat concerned | 25% | 27% | 28% | 26% | 32% | 28% | 33% | 32% |
| Not too concerned | 13% | 13% | 18% | 17% | 14% | 14% | 9% | 18% |
| Not at all concerned | 10% | 12% | 13% | 15% | 16% | 16% | 7% | 12% |
| (VOL) Don’t know | 0% | 0% | 0% | 0% | 0% | 0% | 0% | 0% |
| (VOL) Has already happened | 1% | 0% | 1% | 1% | 0% | 0% | 0% | n/a |
| (n) | (810) | (867) | (868) | (867) | (807) | (808) | (857) | (851) |
31.At any time during the pandemic, did you ever have Covid or think you had Covid? [If YES: Was your Covid status confirmed with a test, were you given the diagnosis by a medical professional without a test, or did you just know you had Covid?]
| TREND: | March 2022 | Jan. 2022 |
| Yes, confirmed with a test | 38% | 27% |
| Yes, given the diagnosis without a test | 4% | 2% |
| Yes, just knew had Covid | 10% | 11% |
| No, have not had Covid | 47% | 59% |
| (VOL) Don’t know | 2% | 1% |
| (n) | (809) | (794) |
32.Please tell me if each of the following has done a good job or bad job dealing with the coronavirus outbreak. [ITEMS WERE ROTATED]
| TREND: | Good Job | Bad Job | (VOL) Mixed, depends | (VOL) Don’t know | (n) |
| President Biden | 49% | 47% | 2% | 2% | (809) |
| — January 2022 | 43% | 53% | 3% | 1% | (794) |
| — December 2021 | 46% | 46% | 4% | 4% | (808) |
| — November 2021 | 53% | 41% | 2% | 3% | (811) |
| — September 2021 | 52% | 43% | 4% | 1% | (802) |
| — July 2021 | 55% | 38% | 4% | 3% | (804) |
| — June 2021 | 59% | 32% | 4% | 5% | (810) |
| — April 2021 | 62% | 31% | 3% | 3% | (800) |
| — March 2021 | 57% | 31% | 3% | 8% | (802) |
| — January 2021 | 58% | 23% | 5% | 15% | (809) |
| Your state’s governor | 59% | 36% | 3% | 3% | (809) |
| — January 2022 | 54% | 41% | 3% | 2% | (794) |
| — December 2021 | 50% | 41% | 5% | 3% | (808) |
| — November 2021 | 60% | 35% | 3% | 3% | (811) |
| — September 2021 | 56% | 38% | 3% | 3% | (802) |
| — July 2021 | 54% | 42% | 3% | 2% | (804) |
| — June 2021 | 58% | 33% | 5% | 4% | (810) |
| — April 2021 | 62% | 34% | 3% | 2% | (800) |
| — March 2021 | 56% | 38% | 3% | 2% | (802) |
| — January 2021 | 57% | 38% | 3% | 2% | (809) |
| — Early September 2020 | 61% | 35% | 3% | 1% | (867) |
| — August 2020 | 57% | 35% | 5% | 3% | (868) |
| — Late June 2020 | 65% | 28% | 5% | 2% | (867) |
| — Early June 2020 | 67% | 28% | 3% | 1% | (807) |
| — May 2020 | 73% | 22% | 3% | 2% | (808) |
| — April 2020 | 72% | 21% | 4% | 3% | (857) |
| — March 2020 | 72% | 18% | 4% | 6% | (851) |
| The American public | 35% | 54% | 8% | 2% | (809) |
| — January 2022 | 29% | 58% | 9% | 3% | (794) |
| — December 2021 | 27% | 56% | 12% | 5% | (808) |
| — November 2021 | 35% | 55% | 7% | 3% | (811) |
| — September 2021 | 23% | 65% | 10% | 2% | (802) |
| — July 2021 | 32% | 51% | 12% | 5% | (804) |
| — June 2021 | 42% | 40% | 14% | 4% | (810) |
| — April 2021 | 43% | 44% | 10% | 4% | (800) |
| — March 2021 | 35% | 53% | 11% | 1% | (802) |
| — January 2021 | 32% | 60% | 6% | 2% | (809) |
| — Early September 2020 | 31% | 57% | 10% | 2% | (867) |
| — August 2020 | 26% | 62% | 11% | 1% | (868) |
| — Late June 2020 | 28% | 59% | 11% | 3% | (867) |
| — Early June 2020 | 46% | 43% | 8% | 2% | (807) |
| — May 2020 | 51% | 33% | 13% | 2% | (808) |
| — April 2020 | 38% | 48% | 12% | 2% | (857) |
| — March 2020 | 38% | 45% | 14% | 3% | (851) |
| Health agencies in the federal government | 53% | 41% | 4% | 2% | (809) |
| — January 2022 | 46% | 47% | 5% | 2% | (794) |
| — December 2021 | 48% | 41% | 6% | 5% | (808) |
| — November 2021 | 53% | 38% | 5% | 4% | (811) |
| — September 2021 | 52% | 38% | 6% | 3% | (802) |
| — July 2021 | 57% | 33% | 7% | 3% | (804) |
| — June 2021 | 55% | 33% | 6% | 5% | (810) |
| — April 2021 | n/a | n/a | n/a | n/a | n/a |
| — March 2021 | 50% | 37% | 8% | 5% | (802) |
| — January 2021 | 52% | 40% | 6% | 3% | (809) |
| — Early September 2020 | n/a | n/a | n/a | n/a | n/a |
| — August 2020 | 46% | 43% | 6% | 4% | (868) |
| — Late June 2020 | n/a | n/a | n/a | n/a | n/a |
| — Early June 2020 | 57% | 34% | 5% | 3% | (807) |
| — May 2020 | 63% | 25% | 7% | 4% | (808) |
| — April 2020 | 66% | 25% | 4% | 4% | (857) |
| — March 2020 | 65% | 24% | 8% | 4% | (851) |
33.Do you support or oppose instituting, or reinstituting, face mask and social distancing guidelines in your state at the current time?
| TREND: | March 2022 | Jan. 2022 | Dec. 2021 | Sept. 2021 | July 2021 |
| Support | 34% | 52% | 55% | 63% | 52% |
| Oppose | 62% | 45% | 42% | 34% | 46% |
| (VOL) Depends | 3% | 1% | 2% | 2% | n/a |
| (VOL) Don’t know | 1% | 2% | 2% | 1% | 2% |
| (n) | (809) | (794) | (808) | (802) | (804) |
34.Do you support or oppose requiring people to show proof of vaccination in order to go to work in an office or setting where they are around other people?
| TREND: | March 2022 | Jan. 2022 | Dec. 2021 | Nov. 2021 | Sept. 2021 |
| Support | 44% | 43% | 46% | 51% | 53% |
| Oppose | 55% | 53% | 50% | 47% | 45% |
| (VOL) Depends | 1% | 2% | 2% | 2% | 2% |
| (VOL) Don’t know | 0% | 2% | 2% | 1% | 1% |
| (n) | (809) | (794) | (808) | (811) | (802) |
35.The C.D.C. recently relaxed its recommendations on the need for face masks and social distancing in areas with a low Covid rate. Do you support or oppose relaxing these recommendations?
| March 2022 | |
| Support | 77% |
| Oppose | 21% |
| (VOL) Depends | 1% |
| (VOL) Don’t know | 1% |
| (n) | (809) |
36.Do you tend to agree or disagree with the following statement: “It’s time we accept that Covid is here to stay and we just need to get on with our lives.”?
| TREND: | March 2022 | Jan. 2022 |
| Agree | 73% | 70% |
| Disagree | 25% | 28% |
| (VOL) Depends | 2% | 2% |
| (VOL) Don’t know | 1% | 1% |
| (n) | (809) | (794) |
37.Would you prefer the government to continue to adjust Covid guidelines and mandates in response to different variants as they arise, to settle on a consistent set of Covid guidelines and mandates that we will use from this point forward, or to have no Covid regulations and mandates?
| March 2022 | |
| Continue to adjust guidelines/mandates | 50% |
| Settle on a consistent set of guidelines/mandates | 14% |
| Have no guidelines/mandates | 34% |
| (VOL) Don’t know | 1% |
| (n) | (809) |
38.Have you received at least one dose of Covid vaccine, or not?
| TREND: | March 2022 | Jan. 2022 | Dec. 2021 | Nov. 2021 | Sept. 2021 | July 2021 | June 2021 | April 2021 |
| Yes | 78% | 77% | 78% | 80% | 75% | 68% | 66% | 51% |
| No | 21% | 20% | 20% | 18% | 21% | 28% | 33% | 48% |
| (VOL) Don’t know | 1% | 4% | 2% | 3% | 4% | 4% | 1% | 1% |
| (n) | (809) | (794) | (808) | (811) | (802) | (804) | (810) | (800) |
39.Have you received a booster shot of the Covid vaccine, or not? [If NOT:] How likely are you to get a booster shot of the vaccine – very likely, somewhat likely, not too likely, or not at all likely?
| TREND: | March 2022 | Jan. 2022 | Dec. 2021 | Nov. 2021 | Sept. 2021 |
| Already received booster | 48% | 45% | 24% | 10%* | 1%* |
| Very likely | 8% | 11% | 27% | 41% | 51% |
| Somewhat likely | 4% | 7% | 13% | 14% | 16% |
| Not too likely | 5% | 7% | 6% | 8% | 6% |
| Not at all likely ** | 33% | 30% | 27% | 25% | 26% |
| (VOL) Don’t know | 1% | 0% | 1% | 2% | 1% |
| (n) | (809) | (794) | (808) | (811) | (802) |
* September/November 2021 polls did not specifically ask if person already got the booster, but included it as a volunteered response.
** Prior to March 2022, this includes results to a previous question on likelihood of getting any dose of the vaccine.
[Q40 previously released.]
METHODOLOGY
The Monmouth University Poll was sponsored and conducted by the Monmouth University Polling Institute from March 10 to 14, 2022 with a probability-based national random sample of 809 adults age 18 and older. This includes 278 contacted by a live interviewer on a landline telephone and 531 contacted by a live interviewer on a cell phone, in English. Telephone numbers were selected through a mix of random digit dialing and list-based sampling. Landline respondents were selected with a modified Troldahl-Carter youngest adult household screen. Interviewing services were provided by Braun Research, with sample obtained from Dynata (RDD, n=545), Aristotle (list, n=140) and a panel of prior Monmouth poll participants (n=124). Monmouth is responsible for all aspects of the survey design, data weighting and analysis. The full sample is weighted for region, age, education, gender and race based on US Census information (ACS 2018 one-year survey). For results based on this sample, one can say with 95% confidence that the error attributable to sampling has a maximum margin of plus or minus 3.5 percentage points (unadjusted for sample design). Sampling error can be larger for sub-groups (see table below). In addition to sampling error, one should bear in mind that question wording and practical difficulties in conducting surveys can introduce error or bias into the findings of opinion polls.
| DEMOGRAPHICS (weighted) |
| Self-Reported |
| 29% Republican |
| 43% Independent |
| 28% Democrat |
| 49% Male |
| 51% Female |
| 30% 18-34 |
| 32% 35-54 |
| 38% 55+ |
| 63% White |
| 13% Black |
| 16% Hispanic |
| 8% Asian/Other |
| 70% No degree |
| 30% 4 year degree |
Click on pdf file link below for full methodology and crosstabs by key demographic groups.


