
West Long Branch, NJ – Neither President Joe Biden nor Vice President Kamala Harris earn positive ratings from the American public as a whole, but both get good marks from at least 3 in 4 of their fellow Democrats. The Monmouth (“Mon-muth”) University Poll also finds that less than 1 in 4 register approval of the U.S. Congress or feel the country is headed in the right direction.
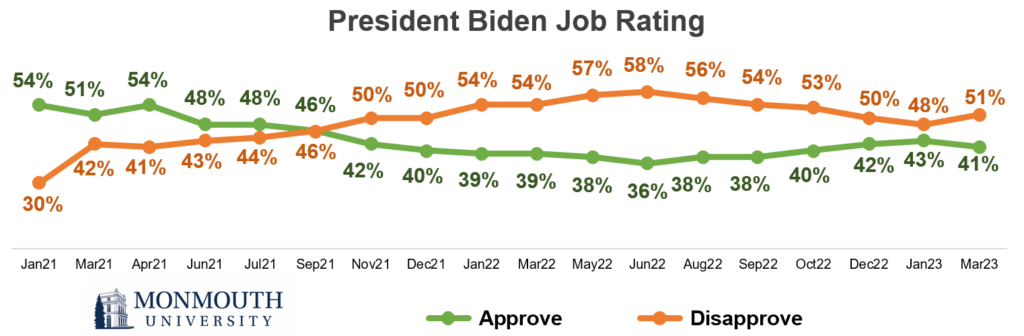
Public opinion of how Biden is doing as president has remained stable since the end of last year. Currently, 41% of Americans approve of his job performance while 51% disapprove. These results are similar to Monmouth polls taken in December (42% approve and 50% disapprove) and January (43% approve and 48% disapprove). Biden’s rating had been slowly improving after hitting a low point last June (36% approve and 58% disapprove), but that trajectory seems to have hit a wall.
The poll also asked about the performance of Vice President Harris, who receives a job rating of 36% approve and 53% disapprove. Both the president and vice president get similar ratings from independents (about 3 in 10 approval for both) and Republicans (6% approval for both). Democrats give a slightly more positive rating to Biden (86% approve and 9% disapprove) than to Harris (76% approve and 16% disapprove), but this difference is not statistically significant. [Note: This is the first time Monmouth has asked the vice president’s job rating.]
“There are some differences between the two, but on the whole, rank and file Democrats seem to hold largely positive opinions of both the president and vice president,” said Patrick Murray, director of the independent Monmouth University Polling Institute.
Public opinion of the U.S. Congress stands at 23% approve and 68% disapprove. Congressional approval has hovered between 15% and 26% since summer 2021. There are no significant partisan differences in public opinion of the job the Congress is doing; just 27% of Democrats, 22% of independents, and 21% of Republicans register approval.
The poll also finds only 22% of Americans say things in the country are going in the right direction while 72% say they have gotten off on the wrong track. The right direction number has ranged between 10% and 31% since September 2021, after hitting a relative high of 46% in April 2021. Unlike the poll’s congressional rating, Democrats (46%) are more likely than independents (17%) or Republicans (5%) to feel the country is headed in the right direction. This follows a trend in Monmouth’s polls where fellow partisans of the current president tend to be relatively more positive about the nation as a whole.
The Monmouth University Poll was conducted by telephone from March 16 to 20, 2023 with 805 adults in the United States. The question results in this release have a margin of error of +/- 5.8 percentage points for the full sample. The poll was conducted by the Monmouth University Polling Institute in West Long Branch, NJ.
QUESTIONS AND RESULTS
(* Some columns may not add to 100% due to rounding.)
1.Do you approve or disapprove of the job Joe Biden is doing as president?
| Trend: | March 2023 | Jan. 2023 | Dec. 2022 | Oct. 2022 | Sept. 2022 | Aug. 2022 | June 2022 | May 2022 | March 2022 | Jan. 2022 |
|---|---|---|---|---|---|---|---|---|---|---|
| Approve | 41% | 43% | 42% | 40% | 38% | 38% | 36% | 38% | 39% | 39% |
| Disapprove | 51% | 48% | 50% | 53% | 54% | 56% | 58% | 57% | 54% | 54% |
| (VOL) No opinion | 8% | 9% | 8% | 7% | 8% | 7% | 6% | 5% | 7% | 7% |
| (n) | (805) | (805) | (805) | (808) | (806) | (808) | (978) | (807) | (809) | (794) |
| Trend: Continued | Dec. 2021 | Nov. 2021 | Sept. 2021 | July 2021 | June 2021 | April 2021 | March 2021 | Jan. 2021 |
|---|---|---|---|---|---|---|---|---|
| Approve | 40% | 42% | 46% | 48% | 48% | 54% | 51% | 54% |
| Disapprove | 50% | 50% | 46% | 44% | 43% | 41% | 42% | 30% |
| (VOL) No opinion | 11% | 9% | 8% | 8% | 9% | 5% | 8% | 16% |
| (n) | (808) | (811) | (802) | (804) | (810) | (800) | (802) | (809) |
2.Do you approve or disapprove of the job Kamala Harris is doing as vice president?
| Response: | March 2023 |
|---|---|
| Approve | 36% |
| Disapprove | 53% |
| No opinion | 12% |
| (n) | (805) |
3.Do you approve or disapprove of the job the U.S. Congress is doing?
| Trend: | March 2023 | Jan. 2023 |
|---|---|---|
| Approve | 23% | 19% |
| Disapprove | 68% | 67% |
| (VOL) No opinion | 10% | 14% |
| (n) | (805) | (805) |
| Trend: | Dec. 2022 | Oct. 2022 | Sept. 2022 | Aug. 2022 | June 2022 | May 2022 | March 2022 | Jan. 2022 | Dec. 2021 | Nov. 2021 | Sept. 2021 | July 2021 | June 2021 | April 2021 | March 2021 | Jan. 2021 |
|---|---|---|---|---|---|---|---|---|---|---|---|---|---|---|---|---|
| Approve | 26% | 23% | 23% | 17% | 15% | 15% | 21% | 19% | 23% | 18% | 22% | 23% | 21% | 35% | 30% | 35% |
| Disapprove | 62% | 69% | 66% | 74% | 78% | 77% | 71% | 74% | 66% | 70% | 65% | 62% | 65% | 56% | 59% | 51% |
| (VOL) No opinion | 12% | 8% | 11% | 9% | 7% | 8% | 8% | 6% | 11% | 12% | 13% | 15% | 15% | 9% | 11% | 14% |
| (n) | (805) | (808) | (806) | (808) | (978) | (807) | (809) | (794) | (808) | (811) | (802) | (804) | (810) | (800) | (802) | (809) |
| Trend: Continued | Nov. 2020 | Early June 2020 | May 2020 | April 2020 | Feb. 2020 | Jan. 2020 | Dec. 2019 | Nov. 2019 | Sept. 2019 | Aug. 2019 | June 2019 | May 2019 | April 2019 | March 2019 | Jan. 2019 |
|---|---|---|---|---|---|---|---|---|---|---|---|---|---|---|---|
| Approve | 23% | 22% | 32% | 32% | 20% | 24% | 22% | 23% | 21% | 17% | 19% | 20% | 24% | 23% | 18% |
| Disapprove | 64% | 69% | 55% | 55% | 69% | 62% | 65% | 64% | 68% | 71% | 69% | 71% | 62% | 68% | 72% |
| (VOL) No opinion | 13% | 9% | 13% | 13% | 11% | 14% | 13% | 13% | 11% | 13% | 12% | 9% | 14% | 9% | 10% |
| (n) | (810) | (807) | (808) | (857) | (902) | (903) | (903) | (908) | (1,161) | (800) | (751) | (802) | (801) | (802) | (805) |
| Trend: Continued | Nov. 2018 | Aug. 2018 | June 2018 | April 2018 | March 2018 | Jan. 2018 | Dec. 2017 | Sept. 2017 | Aug. 2017 | July 2017 | May 2017 | March 2017 | Jan. 2017 |
|---|---|---|---|---|---|---|---|---|---|---|---|---|---|
| Approve | 23% | 17% | 19% | 17% | 18% | 21% | 16% | 17% | 18% | 19% | 19% | 25% | 23% |
| Disapprove | 63% | 69% | 67% | 71% | 72% | 68% | 65% | 69% | 69% | 70% | 68% | 59% | 66% |
| (VOL) No opinion | 14% | 14% | 14% | 12% | 11% | 11% | 19% | 15% | 13% | 11% | 13% | 16% | 11% |
| (n) | (802) | (805) | (806) | (803) | (803) | (806) | (806) | (1,009) | (805) | (800) | (1,002) | (801) | (801) |
| Trend: Continued | Sept. 2016* | Aug. 2016* | June 2016* | March 2016 | Jan. 2016 | Dec. 2015 | Oct. 2015 | Sept. 2015 | Aug. 2015 | July 2015 | June 2015 | April 2015 | Jan. 2015 | Dec. 2014 | July 2013 |
|---|---|---|---|---|---|---|---|---|---|---|---|---|---|---|---|
| Approve | 15% | 14% | 17% | 22% | 17% | 16% | 17% | 19% | 18% | 18% | 19% | 21% | 18% | 17% | 14% |
| Disapprove | 77% | 78% | 76% | 68% | 73% | 73% | 71% | 71% | 72% | 69% | 71% | 67% | 70% | 73% | 76% |
| (VOL) No opinion | 8% | 9% | 7% | 10% | 10% | 10% | 12% | 11% | 11% | 12% | 10% | 12% | 11% | 11% | 10% |
| (n) | (802) | (803) | (803) | (1,008) | (1,003) | (1,006) | (1,012) | (1,009) | (1,203) | (1,001) | (1,002) | (1,005) | (1,003) | (1,008) | (1,012) |
4.Would you say things in the country are going in the right direction, or have they gotten off on the wrong track?
| Trend: | March 2023 | Jan. 2023 |
|---|---|---|
| Right direction | 22% | 24% |
| Wrong track | 72% | 73% |
| (VOL) Depends | 3% | 1% |
| (VOL) Don’t know | 3% | 2% |
| (n) | (805) | (805) |
| Trend: | Dec. 2022 | Sept. 2022 | Aug. 2022 | June 2022 | May 2022 | March 2022 | Jan. 2022 | Dec. 2021 | Nov. 2021 | Sept. 2021 | July 2021 | June 2021 | April 2021 | March 2021 | Jan. 2021 |
|---|---|---|---|---|---|---|---|---|---|---|---|---|---|---|---|
| Right direction | 28% | 23% | 15% | 10% | 18% | 24% | 24% | 30% | 31% | 29% | 38% | 37% | 46% | 34% | 42% |
| Wrong track | 68% | 74% | 82% | 88% | 79% | 73% | 71% | 66% | 64% | 65% | 56% | 57% | 50% | 61% | 51% |
| (VOL) Depends | 2% | 2% | 1% | 1% | 2% | 1% | 3% | 1% | 2% | 4% | 3% | 3% | 2% | 4% | 3% |
| (VOL) Don’t know | 3% | 2% | 2% | 1% | 2% | 2% | 2% | 3% | 3% | 2% | 4% | 3% | 2% | 2% | 4% |
| (n) | (805) | (806) | (808) | (978) | (807) | (809) | (794) | (808) | (811) | (802) | (804) | (810) | (800) | (802) | (809) |
| Trend: Continued | Nov. 2020 | Early Sept. 2020 | Aug. 2020 | Late June 2020 | Early June 2020 | May 2020 | April 2020 | March 2020 | Feb. 2020 | Jan. 2020 |
|---|---|---|---|---|---|---|---|---|---|---|
| Right direction | 26% | 27% | 22% | 18% | 21% | 33% | 30% | 39% | 37% | 37% |
| Wrong track | 68% | 66% | 72% | 74% | 74% | 60% | 61% | 54% | 57% | 56% |
| (VOL) Depends | 4% | 4% | 4% | 5% | 4% | 4% | 5% | 4% | 6% | 6% |
| (VOL) Don’t know | 2% | 3% | 2% | 3% | 1% | 3% | 5% | 3% | 1% | 1% |
| (n) | (810) | (867) | (868) | (867) | (807) | (808) | (857) | (851) | (902) | (903) |
| Trend: Continued | Dec. 2019 | Nov. 2019 | Sept. 2019 | Aug. 2019 | June 2019 | May 2019 | April 2019 | March 2019 | Nov. 2018 | Aug. 2018 | June 2018 | April 2018 | March 2018 | Jan. 2018 |
|---|---|---|---|---|---|---|---|---|---|---|---|---|---|---|
| Right direction | 32% | 30% | 30% | 28% | 31% | 29% | 28% | 29% | 35% | 35% | 40% | 33% | 31% | 37% |
| Wrong track | 56% | 61% | 61% | 62% | 62% | 63% | 62% | 63% | 55% | 57% | 53% | 58% | 61% | 57% |
| (VOL) Depends | 8% | 7% | 6% | 8% | 6% | 4% | 7% | 6% | 7% | 6% | 3% | 5% | 6% | 3% |
| (VOL) Don’t know | 4% | 2% | 2% | 2% | 2% | 3% | 3% | 2% | 3% | 3% | 3% | 4% | 1% | 3% |
| (n) | (903) | (908) | (1,161) | (800) | (751) | (802) | (801) | (802) | (802) | (805) | (806) | (803) | (803) | (806) |
| Trend: Continued | Dec. 2017 | Aug. 2017 | May 2017 | March 2017 | Jan. 2017 | Aug. 2016* | Oct. 2015 | July 2015 | June 2015 | April 2015 | Dec. 2014 | July 2013 |
|---|---|---|---|---|---|---|---|---|---|---|---|---|
| Right direction | 24% | 32% | 31% | 35% | 29% | 30% | 24% | 28% | 23% | 27% | 23% | 28% |
| Wrong track | 66% | 58% | 61% | 56% | 65% | 65% | 66% | 63% | 68% | 66% | 69% | 63% |
| (VOL) Depends | 7% | 4% | 5% | 4% | 4% | 2% | 6% | 5% | 5% | 5% | 5% | 5% |
| (VOL) Don’t know | 3% | 5% | 3% | 5% | 2% | 3% | 4% | 3% | 3% | 2% | 3% | 4% |
| (n) | (806) | (805) | (1,002) | (801) | (801) | (803) | (1,012) | (1,001) | (1,002) | (1,005) | (1,008) | (1,012) |
[Q5-27 held for future release.]
Methodology
The Monmouth University Poll was sponsored and conducted by the Monmouth University Polling Institute from March 16 to 20, 2023 with a probability-based national random sample of 805 adults age 18 and older. This includes 284 contacted by a live interviewer on a landline telephone and 521 contacted by a live interviewer on a cell phone, in English. Telephone numbers were selected through a mix of random digit dialing and list-based sampling. Landline respondents were selected with a modified Troldahl-Carter youngest adult household screen. Interviewing services were provided by Braun Research, with sample obtained from Dynata (RDD, n= 479), Aristotle (list, n= 133) and a panel of prior Monmouth poll participants (n= 193). Monmouth is responsible for all aspects of the survey design, data weighting and analysis. The full sample is weighted for region, age, education, gender and race based on US Census information (ACS 2021 one-year survey). For results based on this sample, one can say with 95% confidence that the error attributable to sampling has a maximum margin of plus or minus 5.8 percentage points (adjusted for sample design effects). Sampling error can be larger for sub-groups (see table below). In addition to sampling error, one should bear in mind that question wording and practical difficulties in conducting surveys can introduce error or bias into the findings of opinion polls.
DEMOGRAPHICS (weighted) |
| Self-Reported |
| 25% Republican |
| 45% Independent |
| 30% Democrat |
| 49% Male |
| 51% Female |
| 29% 18-34 |
| 33% 35-54 |
| 38% 55+ |
| 61% White |
| 12% Black |
| 17% Hispanic |
| 10% Asian/Other |
| 67% No degree |
| 33% 4 year degree |
Click on pdf file link below for full methodology and crosstabs by key demographic groups.


