West Long Branch, NJ – As the country went through the annual ritual of setting clocks ahead one hour this weekend, the Monmouth (“Mon-muth”) University Poll found about 1 in 3 Americans want to maintain this clock-resetting practice. A plurality would actually prefer to make daylight saving time permanent, while using standard time year-round draws few backers.
Six in 10 Americans (61%) would do away with the nation’s twice-a-year time change while a little over one-third (35%) want to keep the current practice. Those who want to stick with a single year-round time prefer to have later sunrise and sunset hours (44%) than the earlier setting offered by standard time (13%).
There are not a lot of regional variations in these opinions either across time zones or by relative latitude. The preferences of respondents interviewed by Monmouth after the change to daylight saving time on Sunday morning are practically identical to those interviewed before clocks were reset.
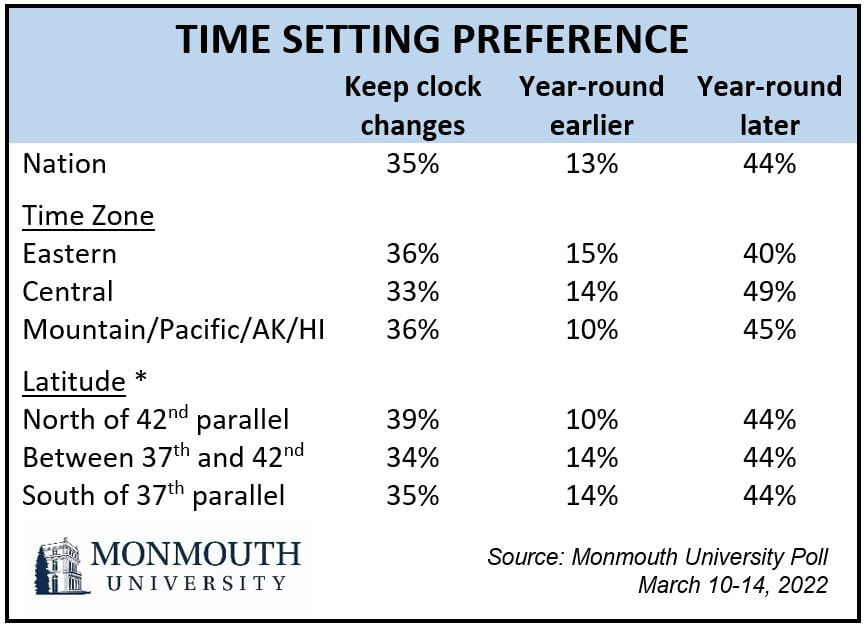
“The later light provided by daylight saving time is fairly popular. Changing back and forth to it each year is not,” said Patrick Murray, director of the independent Monmouth University Polling Institute.
Public opinion of daylight saving time may depend on how – and when – the question is asked.
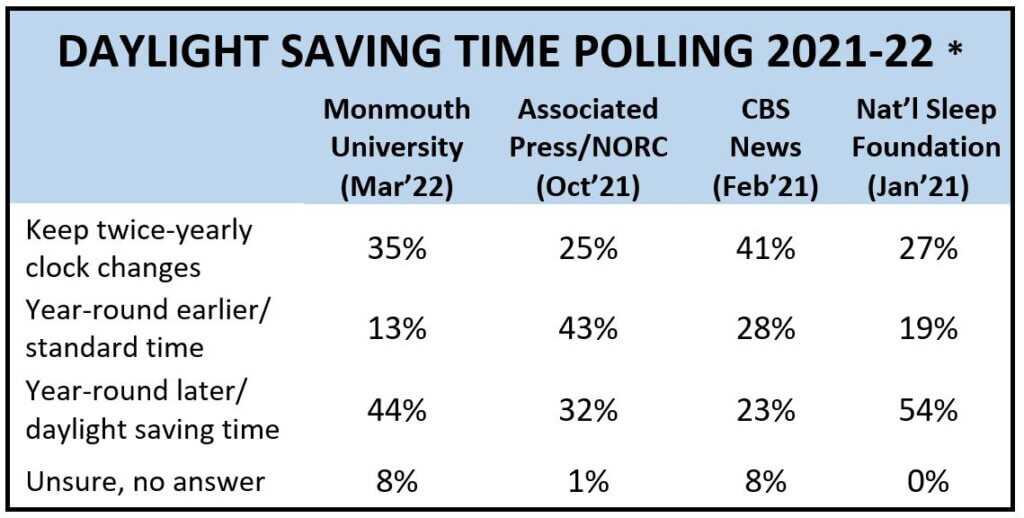
Other polls about resetting the nation’s clocks have been conducted in the past year, but not always with the same findings. A National Sleep Foundation survey conducted by Langer Research in January 2021 yielded a similar pattern to the Monmouth results, but it showed a clear majority preference for permanent daylight saving time (54%) and a lower preference for maintaining the practice of resetting clocks (27%).
The questions asked in these polls were somewhat different. The Monmouth telephone poll posed the question in two parts – first asking simply whether respondents wanted to keep or do away with the practice of resetting clocks, then asking those who wanted to do away with the change which set time they would prefer – while the National Sleep Foundation online poll included all options in a single question. Also, the Monmouth question referenced this month’s switch to daylight saving time in the root of the question but described the two options only by when the sun would rise and set (i.e. earlier or later). The National Sleep Foundation survey included both the names of the time settings (daylight saving and standard) and a description of sunrise and sunset light. These format and mode differences could account for the varying levels of support for each option in the two polls’ results, including a tendency to default to the status quo when alternatives are not known.
A CBS News poll conducted in February 2021, on the other hand, showed very different results from the other two polls. Specifically, it found that a plurality of the country wanted to keep the current system of resetting clocks (41%) with the remainder being about evenly divided between using either of the two settings all year round. The CBS question differed from the other two polls in that it asked respondents to choose between “Daylight Savings [sic] Time” and “Standard Time” without describing the relative sun position in each. [See poll question wording after the table below.]
“The two polls that described when the sun would rise and set produced a similar pattern in the results. Both of them differed, though, from the poll question that assumed respondents knew the relative sun movement in each time setting named. It appears that without these relative descriptions, some respondents may be more likely to default to the status quo due to lack of familiarity with the names associated with each seasonal change,” said Murray.
A fourth poll, from the Associated Press and NORC, described the sun’s position during daylight saving time and standard time, but it produced somewhat different results than Monmouth and the National Sleep Foundation. This poll, conducted in October 2021, found similarly low support for the semiannual clock resetting ritual (25%), but recorded a greater preference for using standard time all year (43%) than daylight saving time (32%).
“A couple of things could be at work here. The first is question wording. Even though all three polls described sunrise and sunset light in their questions, the Monmouth and National Sleep Foundation polls included the sun’s position explicitly in the response options. The AP-NORC wording required more cognitive processing because it described each time setting only in relation to the other in the root of the question. Also, it did not make that difference clear in the actual response options. That could have led to some confusion,” said Murray. “Another possible explanation for the differences is that the AP-NORC poll was conducted during the final weeks before the end of daylight saving time, while the other polls were conducted during standard time, or in the case of Monmouth, during the change to daylight saving time. Maybe we simply grow tired of our current time setting and look forward to a change in sunlight, even though we may grumble about having to reset our clocks each time.”
Murray added, “Question wording is an imperfect craft, but it appears the poll questions that include straightforward descriptions of when the sun is shining in the response options are probably closer to reflecting the current state of public opinion on daylight saving time. That is, of course, unless we ask the same question in October and get entirely different results.”
* Question wording:
Monmouth – “As you know, most of the country resets their clocks for daylight saving time this weekend. Would you rather keep this practice where we reset our clocks in the fall and the spring or would you rather do away with the time changes? [IF “DO AWAY”:] If the country was to choose one set time for the entire year, would you rather have the sun rise earlier in the morning and set earlier in the evening, or would you rather have the sun rise later in the morning and set later in the evening?”
AP/NORC – “As you may know, daylight saving time is the practice of setting clocks one hour later in the summer, so that the sun rises and sets one hour later than it would during standard time. During standard time, the sun rises and sets one hour earlier than during daylight saving time. Would you prefer to use daylight saving time all year round, standard time all year round, or switch back and forth between them?”
CBS – “Would you prefer to see Daylight Savings Time extended to all year round, Standard Time extended to all year round, or do you prefer to switch back and forth between the two?”
Natl Sleep Fndn – “Currently in most of the country clocks are set forward by one hour in the spring, called daylight saving time, and are set back by one hour in the fall, to standard time. Which of these do you prefer – change to year-round daylight saving time (later sunrise, more daylight in the evening), change to year-round standard time (earlier sunrise, less daylight in the evening), keep the current system?”
The Monmouth University Poll was conducted by telephone from March 10 to 14, 2022 with 809 adults in the United States. The question results in this release have a margin of error of +/- 3.5 percentage points. The poll was conducted by the Monmouth University Polling Institute in West Long Branch, NJ.
QUESTIONS AND RESULTS
(* Some columns may not add to 100% due to rounding.)
[Q1-39 held for future release.]
40.As you know, most of the country resets their clocks for daylight saving time this weekend. Would you rather keep this practice where we reset our clocks in the fall and the spring or would you rather do away with the time changes? [If “DO AWAY,” ASK:] If the country was to choose one set time for the entire year, would you rather have the sun rise earlier in the morning and set earlier in the evening, or would you rather have the sun rise later in the morning and set later in the evening?
| March 2022 | |
| Keep time change | 35% |
| Do away, set earlier | 13% |
| Do away, set later | 44% |
| Do away, not sure when to set | 4% |
| (VOL) Don’t know | 4% |
| (n) | (809) |
METHODOLOGY
The Monmouth University Poll was sponsored and conducted by the Monmouth University Polling Institute from March 10 to 14, 2022 with a probability-based national random sample of 809 adults age 18 and older. This includes 278 contacted by a live interviewer on a landline telephone and 531 contacted by a live interviewer on a cell phone, in English. Telephone numbers were selected through a mix of random digit dialing and list-based sampling. Landline respondents were selected with a modified Troldahl-Carter youngest adult household screen. Interviewing services were provided by Braun Research, with sample obtained from Dynata (RDD, n=545), Aristotle (list, n=140) and a panel of prior Monmouth poll participants (n=124). Monmouth is responsible for all aspects of the survey design, data weighting and analysis. The full sample is weighted for region, age, education, gender and race based on US Census information (ACS 2018 one-year survey). For results based on this sample, one can say with 95% confidence that the error attributable to sampling has a maximum margin of plus or minus 3.5 percentage points (unadjusted for sample design). Sampling error can be larger for sub-groups (see table below). In addition to sampling error, one should bear in mind that question wording and practical difficulties in conducting surveys can introduce error or bias into the findings of opinion polls.
| DEMOGRAPHICS (weighted) |
| Self-Reported |
| 29% Republican |
| 43% Independent |
| 28% Democrat |
| 49% Male |
| 51% Female |
| 30% 18-34 |
| 32% 35-54 |
| 38% 55+ |
| 63% White |
| 13% Black |
| 16% Hispanic |
| 8% Asian/Other |
| 70% No degree |
| 30% 4 year degree |
Click on pdf file link below for full methodology and crosstabs by key demographic groups.


