
West Long Branch, NJ – A majority of New Jerseyans support allowing motorists to pump their own gas in the state – but only if stations were required to maintain a staffed full-service option. At the same time, the Monmouth (“Mon-muth”) University Poll finds most Garden State residents are fine with New Jersey being the only state that bans all self-service gas. However, more than 2 in 3 say they would pump their own gas if given the option, although they are under no illusion that self service would bring the price of gas down from the current full-service benchmark. As many New Jerseyans would suspect, there are some significant gender differences in attitudes toward pump-your-own gas.
Just over half of the public (54%) supports allowing self-service gas in the state as long as stations are still required to keep an attendant on duty for full service. Another 43% of New Jerseyans oppose this idea. A clear majority (60%), though, are opposed to a pump-your-own policy that would allow stations to do away with full service entirely.
Few New Jerseyans (21%) believe that introducing a pump-your-own option would bring down the cost of gas. Most (76%) believe that the self-service price would stay about the same as the full-service price is now. If offered the choice of self-service versus a full-service option that cost 15 cents more per gallon, 70% of New Jerseyans say they would get out and pump their own gas at the lower price. One in four (26%), though, would still wait for an attendant and pay the higher price.
“New Jerseyans looking for a self-service option seem to want it for the convenience, not because they expect to save money. But they also want to ensure there is access to a full-service attendant for times they do not want to get out of the car to fill their tank,” said Patrick Murray, director of the independent Monmouth University Polling Institute.
A majority (55%) of Garden State residents say that New Jersey being the only state that does not allow self service at any gas station is a good thing for the state. Just 34% see this as a bad thing. [Note: the only other partial holdout, Oregon, allows self service in rural areas.]
“The argument that New Jersey should be embarrassed because it is an anomaly on this issue doesn’t hold much sway with residents here. Being the last full-service-only state in the country seems to be a source of pride for many New Jerseyans,” said Murray.
There are some significant gender differences in the poll. Men are more likely than women to support allowing self-service gas either while keeping the full-service option (63% men and 45% women) or while allowing stations to do away with full service (48% men and 28% women). Men (78%) are somewhat more likely than women (62%) to say they would get out and pump their own gas if the self-service price was 15 cents cheaper – although it’s worth noting that majorities of both sexes say they would use self service under these circumstances. While men are evenly divided between seeing New Jersey’s status as the only state to ban all self-service gas as either a good thing (46%) or bad thing (44%), women are much more likely to see this anomaly as a positive (64%) rather than a negative (24%).
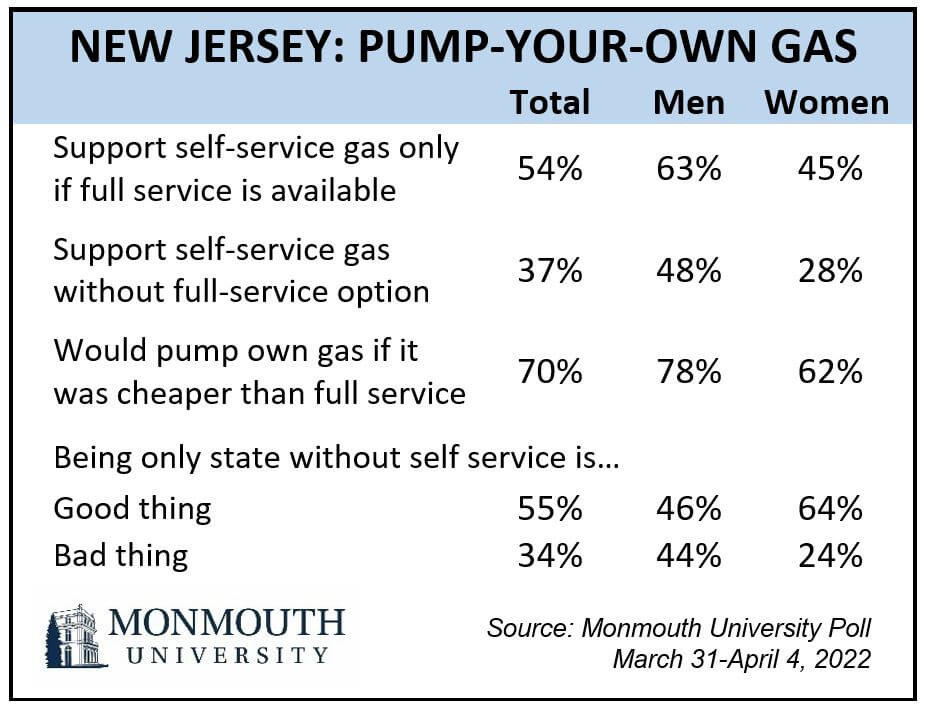
“The old saying is true. While Jersey boys may be fine with self-serve, Jersey girls don’t pump gas. Or at least they don’t want to,” said Murray.
About 6 in 10 New Jerseyans say they are experiencing either a great deal (24%) or some (36%) hardship from recent increases in gas prices. New Jerseyans are somewhat less likely than Americans as a whole to say they are suffering a great deal. State residents who are suffering at least some hardship from rising gas prices are slightly less likely than others to support allowing self-service gas with a full-service option but slightly more likely to say they would pump their own gas if presented with a choice where full service was more expensive. Otherwise, feeling the pinch from current gas prices has no impact on opinion about self-service gas in New Jersey.
The Monmouth University Poll was conducted by telephone from March 31 to April 4, 2022 with 802 New Jersey adults. The question results in this release have a margin of error of +/- 3.5 percentage points. The poll was conducted by the Monmouth University Polling Institute in West Long Branch, NJ.
QUESTIONS AND RESULTS
(* Some columns may not add to 100% due to rounding.)
[Q1 held for future release.]
[Q2-14 previously released.]
[QUESTIONS 15 & 16 WERE ROTATED]
15.Would you favor or oppose allowing self-service, that is the ability to pump your own gas, in New Jersey if each gas station was still required to have an attendant on hand for full-service gas?
| April 2022 | |
| Favor | 54% |
| Oppose | 43% |
| (VOL) Don’t know | 3% |
| (n) | (802) |
16.Would you favor or oppose allowing self-service, that is the ability to pump your own gas, in New Jersey if gas stations were allowed to do away with providing attendants for full-service gas?
| April 2022 | |
| Favor | 37% |
| Oppose | 60% |
| (VOL) Don’t know | 3% |
| (n) | (802) |
17.If New Jersey allowed self-service gas, do you think the price of gas for those choosing to pump their own would be cheaper than current prices or stay about the same as it is now?
| April 2022 | |
| Cheaper than current prices | 21% |
| About the same as it is now | 76% |
| (VOL) Go up | 1% |
| (VOL) Don’t know | 2% |
| (n) | (802) |
18.Let’s say you pull up to a gas station that has both self- and full-service, and the full-service gas costs 15 cents more a gallon. Are you more likely to pump your own gas at the lower price or more likely to have an attendant pump your gas at the higher price?
| April 2022 | |
| Pump own gas | 70% |
| Pumped by attendant | 26% |
| (VOL) Neither, don’t drive | 1% |
| (VOL) Don’t know | 3% |
| (n) | (802) |
19.New Jersey is the only state that does not allow self-service gas at any station. Do you see this as a good thing or a bad thing?
| April 2022 | |
| Good thing | 55% |
| Bad thing | 34% |
| (VOL) Neither | 9% |
| (VOL) Don’t know | 2% |
| (n) | (802) |
20.Have recent increases in gas prices caused you any financial hardship – would you say a great deal, some, not much, or not at all?
| COMPARISON: | National | |||
| April 2022 | March 2022 | |||
| A great deal | 24% | 38% | ||
| Some | 36% | 30% | ||
| Not much | 22% | 18% | ||
| Not at all | 18% | 14% | ||
| (VOL) Don’t know | 0% | 0% | ||
| (n) | (802) | (809) |
[Q21-45 held for future release.]
METHODOLOGY
The Monmouth University Poll was sponsored and conducted by the Monmouth University Polling Institute from March 31 to April 4, 2022 with a probability-based random sample of 802 New Jersey adults age 18 and older, in English. This includes 280 contacted by a live interviewer on a landline telephone and 522 contacted by a live interviewer on a cell phone. Telephone numbers were selected through random digit dialing and landline respondents were selected with a modified Troldahl-Carter youngest adult household screen. Monmouth is responsible for all aspects of the survey design, data weighting and analysis. The full sample is weighted for region, age, education, gender and race based on US Census information (ACS 2018 one-year survey). Data collection support provided by Braun Research (field) and Dynata (RDD sample). For results based on this sample, one can say with 95% confidence that the error attributable to sampling has a maximum margin of plus or minus 3.5 percentage points (unadjusted for sample design). Sampling error can be larger for sub-groups (see table below). In addition to sampling error, one should bear in mind that question wording and practical difficulties in conducting surveys can introduce error or bias into the findings of opinion polls.
NJ Regions (by county)
North – Bergen, Essex, Hudson, Morris, Passaic, Sussex, Union, Warren
Central – Hunterdon, Mercer, Middlesex, Monmouth, Somerset
South – Atlantic, Burlington, Camden, Cape May, Cumberland, Gloucester, Ocean, Salem
| DEMOGRAPHICS (weighted) |
| Self-Reported |
| 24% Republican |
| 40% Independent |
| 36% Democrat |
| 49% Male |
| 51% Female |
| 28% 18-34 |
| 34% 35-54 |
| 38% 55+ |
| 58% White |
| 12% Black |
| 19% Hispanic |
| 11% Asian/Other |
| 61% No degree |
| 39% 4 year degree |
Click on pdf file link below for full methodology and crosstabs by key demographic groups.


