
West Long Branch, NJ – Gov. Phil Murphy’s job rating continues to be in positive territory, although independents have become more negative during his second term. The latest Monmouth (“Mon-muth”) University Poll of New Jersey residents finds views of how the governor’s policies impact property tax payers and the middle class continue to be more negative than positive. The poll also finds qualified support for Murphy’s proposed corporate fee to fund New Jersey Transit upgrades, but most are not confident this will lead to significant improvements.
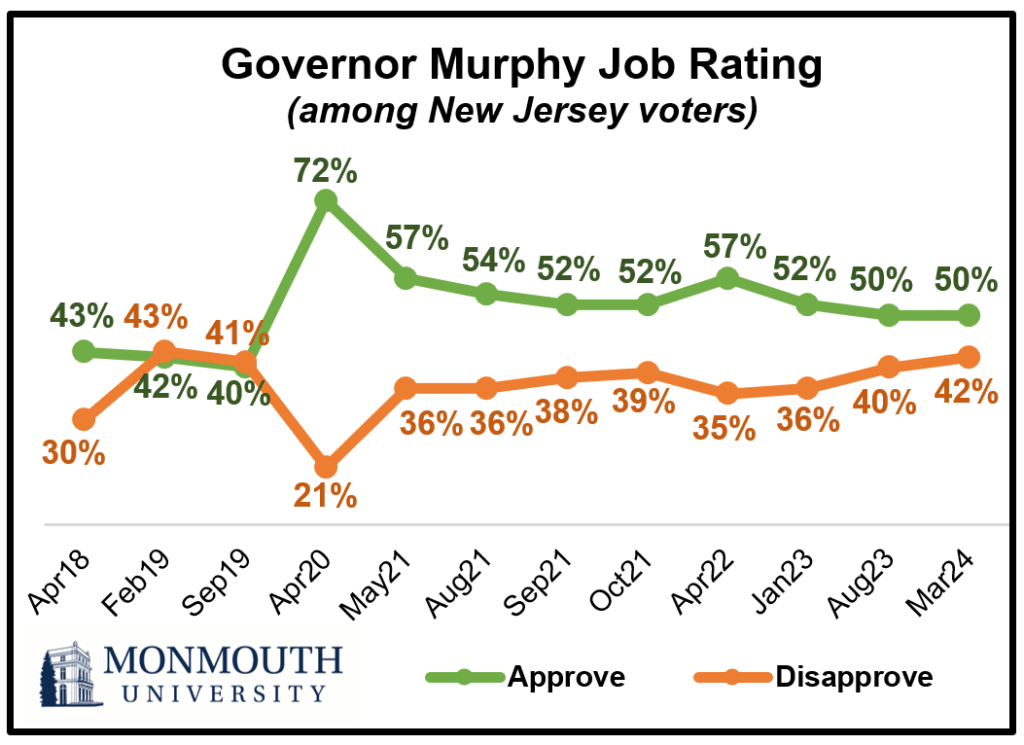
Murphy’s overall job performance rating stands at 50% approve and 42% disapprove among all New Jersey adults, with the same results among the state’s registered voters. These numbers are similar to Monmouth’s last New Jersey poll in August, but they remain slightly more negative than at the start of Murphy’s second term (55% approve and 35% disapprove in April 2022). The shift in Murphy’s rating over the past two years is due largely to an increase in the number of independents who disapprove of his job performance – 49%, up from 35% two years ago – while independent approval has gone down to 43% from 51% in 2022. The governor’s rating has been more stable among both Democrats (83% approve now and 86% in 2022) and Republicans (79% disapprove now and 77% disapprove in 2022).
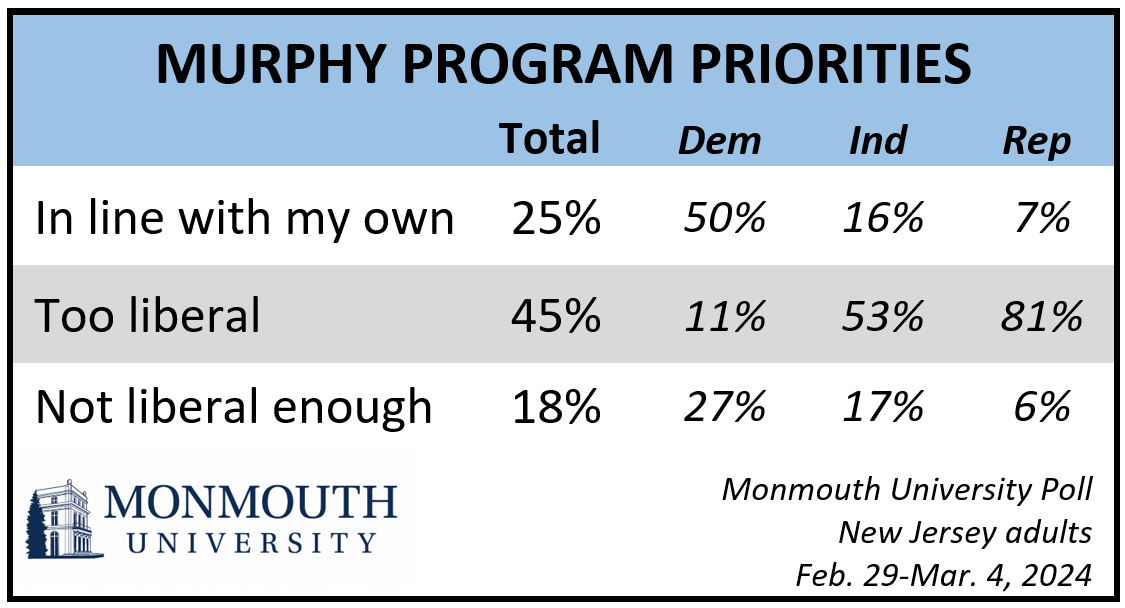
Murphy gets somewhat better reviews for managing state finances than for his policy priorities. More than half (53%) of state residents say the governor has done a good job managing New Jersey’s finances over the past six years, while 43% say he has done a bad job. However, only 25% say Murphy’s program priorities are in line with their own priorities for how the state spends its budget. Nearly half (45%) say Murphy’s priorities are too liberal for them and another 18% feel Murphy’s priorities are not liberal enough. Not surprisingly, 81% of Republicans say the programs Murphy emphasizes are too liberal for them. They are joined by 53% of independents in this view. Among Democrats, 50% say Murphy’s spending priorities are in line with their own, while just 11% feel they are too liberal and 27% feel they are not liberal enough.
“The prevailing opinion is that Murphy does a decent job keeping an eye on the books, but there is disagreement on where he chooses to focus his efforts. This is more of a general sense about his priorities than a specific critique of any given policy, given that few New Jerseyans actually follow the budget process,” said Patrick Murray, director of the independent Monmouth University Polling Institute.
Less than half (45%) of New Jersey residents have heard about the 2025 fiscal year budget that Murphy proposed two weeks ago. Independents (51%) and Democrats (47%) are more likely than Republicans (34%) to have heard something about this. Opinion on the budget plan is divided, with 5% who are satisfied with it, 19% who are not particularly satisfied but can live with it, and 16% who are dissatisfied with it. The remaining 6 in 10 have no opinion or have not heard about the proposal.
The Monmouth University Poll also asked how Murphy’s policies have affected six different constituent groups in New Jersey. His worst ratings are for his impact on property tax payers (24% helped and 48% hurt) and middle-class residents (27% helped and 47% hurt). Looking at trends in how Murphy’s policies have affected the middle class, the “helped” number is about where it’s been for the past three years after a low point of 17% in September 2019, but the “hurt” number has steadily climbed from a low of 31% in 2019, to 36% in 2021, 38% in 2022, and 44% in 2023. Over this same time span, the number of New Jerseyans who say Murphy’s policies hurt property tax payers has held relatively stable. On the other hand, the number who say property tax payers have been helped by Murphy is actually up, albeit slightly. From 2019 to 2022 this number ranged between 6% and 14%, but it went up to 23% last year, which is similar to the current poll result.
“There has been a slight improvement for Murphy on handling property taxes, but his grades on this issue as well as views of his administration’s impact on the middle class in general remain generally negative,” said Murray.
Public opinion is more evenly divided, on how the Murphy administration has affected the lives of poor residents (35% helped and 33% hurt) and wealthy residents (26% helped and 21% hurt). The effect of the governor’s policies for businesses in the state is seen as somewhat more negative (39% hurt) than positive (30% helped). These results are largely in line with polling over the past two years.
The poll also asked about the impact of Murphy’s policies on transit riders. Overall, 19% of New Jerseyans say he has helped transit riders and 28% say he has hurt this group. These numbers have fluctuated throughout the governor’s time in office, ranging between 14% and 26% for helping transit riders and between 17% and 28% for hurting them. The current numbers are a little more negative than last year (26% helped and 20% hurt in August 2023). However, most residents say Murphy’s policies have either had no impact on transit riders (29%) or have no opinion (24%) on how this group has been affected. Regular transit riders represent a small subset of the population, which is part of the reason for the relatively high proportion of state residents who have no opinion on this question. Just 1 in 6 New Jerseyans are regular transit riders (4% daily, 5% several times a week, and 7% several times a month), while another 43% are occasional transit users and 40% never use public transportation. Among regular transit riders, 32% say they have been helped by Murphy’s policies, 28% say they have been hurt, and 31% say there has been no impact.
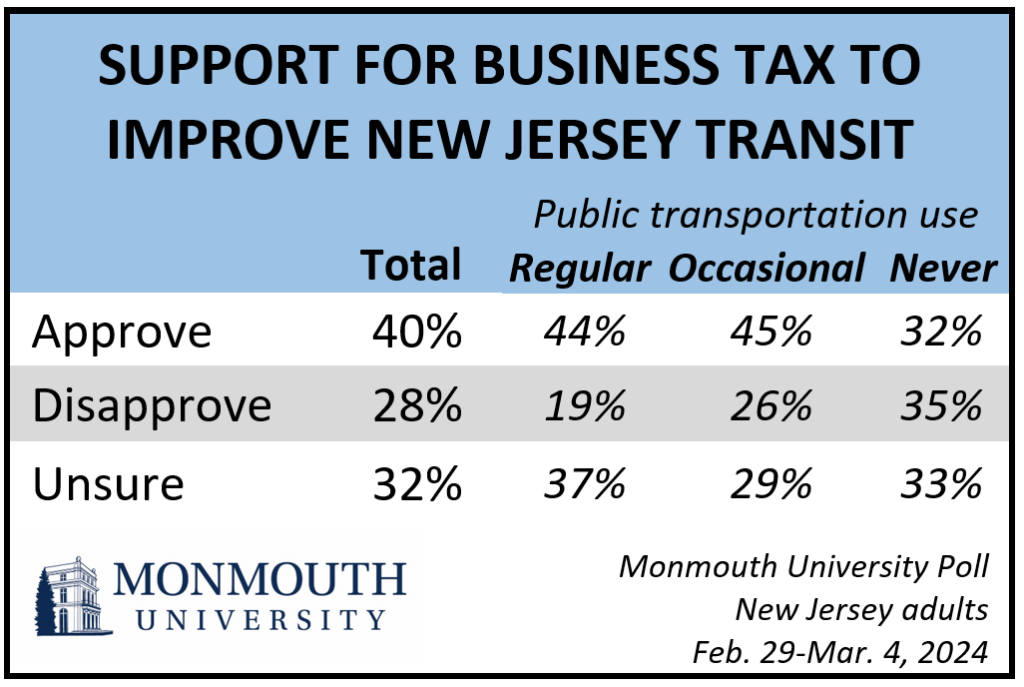
In his state budget announcement, Murphy proposed a tax on businesses that have annual profits over $10 million to create a dedicated fund to improve the infrastructure and performance of New Jersey Transit, the agency that runs most of the buses and trains in the state. Four in 10 (40%) New Jerseyans approve of this tax proposal, 28% disapprove of it, and 32% are unsure about it. Most Democrats (68%) support this plan while half (50%) of Republicans oppose it. Among transit users, 44% of regular riders and 45% of occasional riders approve of this proposal, while only 32% of non-riders agree.
There is not overwhelming confidence that such a fund would achieve its aims. Only 4 in 10 state residents are confident this dedicated fund will lead to significant improvements at New Jersey Transit – with just 6% very confident and 35% somewhat confident. Another 26% of the public are not too confident about the outcome of this policy and 30% are not at all confident. Democrats (70%) are much more likely than either independents (30%) or Republicans (14%) to express at least some confidence that this plan will lead to significant transit improvements. Just under half of public transportation users (48% regular riders and 46% occasional riders) have at least some confidence in the plan, compared with just 1 in 3 (32%) non-riders.
“Public transportation is an interesting policy issue because while not everyone uses it, everyone is affected by it. There seems to be qualified support for Murphy’s corporate fee proposal but also sizable amount of doubt that it will work,” said Murray.
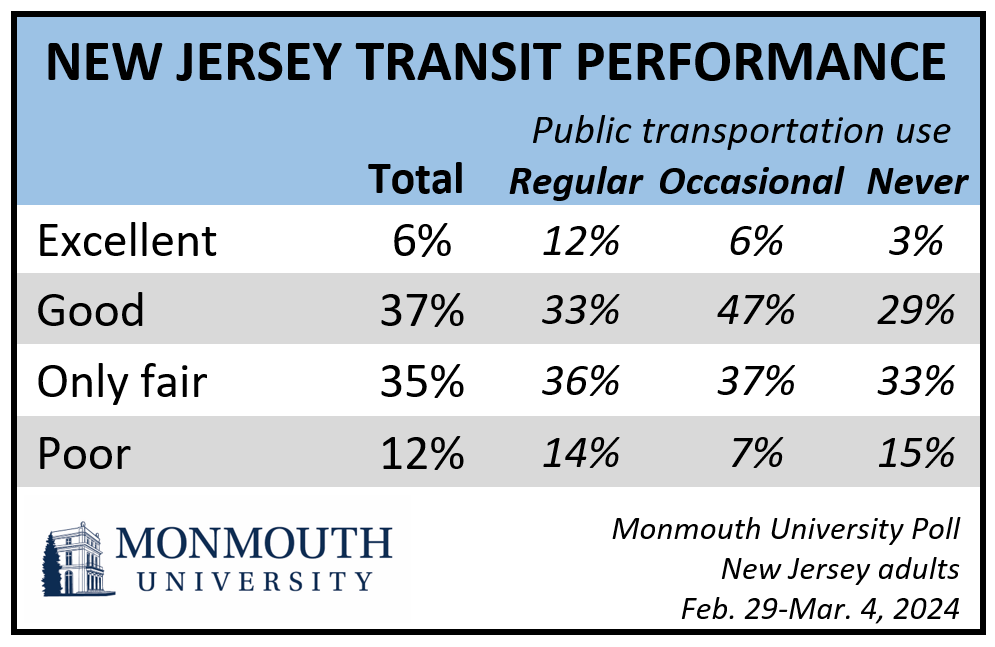
Just over 4 in 10 state residents give New Jersey Transit a positive rating of excellent (6%) or good (37%) for its present job performance. Another 35% say the agency does an only fair job and 12% say it does a poor job. Democrats (58%) are more likely than Republicans (36%) or independents (33%) to give New Jersey Transit positive marks for the job it is doing. Among public transportation users, occasional riders (53%) are somewhat more likely than regular riders (45%) to give the agency a positive rating.
Those earning less than $50,000 a year (24%) are more likely to rely on transit regularly than those who make between $50,000 and $100,000 (10%). New Jerseyans with annual incomes over $100,000 (17%) are midway between the two lower income brackets in terms of their regular use of transit. It is also worth noting that nearly two-thirds (64%) of regular transit riders identify politically as Democrats or lean toward the Democratic Party (compared with 49% of the general public).
Other results from the poll find that opinion of the state legislature’s performance stands at 40% approve and 45% disapprove. This rating was somewhat more positive at the start of the prior legislative session in 2022 (44% approve and 39% disapprove). Most Democrats give the state legislature positive marks (65%), but few independents (35%) and Republicans (13%) agree.
The Monmouth University Poll was conducted by telephone from February 29 to March 4, 2024 with 801 New Jersey adults. The question results in this release have a margin of error of +/- 4.2 percentage points for the full sample. The poll was conducted by the Monmouth University Polling Institute in West Long Branch, NJ.
QUESTIONS AND RESULTS
(* Some columns may not add to 100% due to rounding.)
[Q1 held for future release.]
2.Do you approve or disapprove of the job Phil Murphy is doing as governor?
| Trend: All adults | March 2024 | Aug. 2023 | Jan. 2023 | April 2022 | Oct. 2021 | Sept. 2021 | Aug. 2021 | May 2021 | April 2020 | Sept. 2019 | Feb. 2019 | April 2018 |
|---|---|---|---|---|---|---|---|---|---|---|---|---|
| Approve | 50% | 50% | 53% | 55% | n/a | n/a | n/a | 57% | 71% | 41% | 43% | 44% |
| Disapprove | 42% | 39% | 35% | 35% | n/a | n/a | n/a | 35% | 21% | 38% | 40% | 28% |
| (VOL) No opinion | 8% | 11% | 12% | 10% | n/a | n/a | n/a | 8% | 8% | 21% | 17% | 28% |
| (n) | (801) | (814) | (809) | (802) | n/a | n/a | n/a | (706) | (704) | (713) | (604) | (703) |
| Trend: Registered voters | March 2024 | Aug. 2023 | Jan. 2023 | April 2022 | Oct. 2021 | Sept. 2021 | Aug. 2021 | May 2021 | April 2020 | Sept. 2019 | Feb. 2019 | April 2018 |
|---|---|---|---|---|---|---|---|---|---|---|---|---|
| Approve | 50% | 50% | 52% | 57% | 52% | 52% | 54% | 57% | 72% | 40% | 42% | 43% |
| Disapprove | 42% | 40% | 36% | 35% | 39% | 38% | 36% | 36% | 21% | 41% | 43% | 30% |
| (VOL) No opinion | 8% | 10% | 12% | 9% | 9% | 10% | 10% | 7% | 7% | 19% | 16% | 27% |
| (n) | (757) | (778) | (756) | (738) | (1,000) | (804) | (810) | (661) | (635) | (651) | (549) | (632) |
3.Do you approve or disapprove of the job the state legislature is doing?
| Trend: All adults | March 2024 | Aug. 2023 | Jan. 2023 | April 2022 | May 2021 | April 2020 | Sept. 2019 | Feb. 2019 | April 2018 |
|---|---|---|---|---|---|---|---|---|---|
| Approve | 40% | 37% | 44% | 44% | 47% | 54% | 33% | 37% | 36% |
| Disapprove | 45% | 45% | 37% | 39% | 38% | 27% | 42% | 42% | 39% |
| (VOL) No opinion | 14% | 18% | 19% | 17% | 14% | 19% | 25% | 21% | 24% |
| (n) | (801) | (814) | (809) | (802) | (706) | (704) | (713) | (604) | (703) |
| Trend: Registered voters | March 2024 | Aug. 2023 | Jan. 2023 | April 2022 | May 2021 | April 2020 | Sept. 2019 | Feb. 2019 | April 2018 |
|---|---|---|---|---|---|---|---|---|---|
| Approve | 41% | 37% | 43% | 45% | 47% | 56% | 32% | 35% | 34% |
| Disapprove | 45% | 46% | 38% | 40% | 40% | 28% | 45% | 45% | 42% |
| (VOL) No opinion | 14% | 17% | 19% | 15% | 12% | 16% | 22% | 20% | 24% |
| (n) | (757) | (778) | (756) | (738) | (661) | (635) | (651) | (549) | (632) |
| Trend: Registered voters continued | July 2017 | May 2016 | July 2015 | May 2015 | Feb. 2015 | Sept. 2014 | June 2014 | April 2014 | Feb. 2014 | Jan. 2014 |
|---|---|---|---|---|---|---|---|---|---|---|
| Approve | 23% | 29% | 32% | 33% | 37% | 35% | 36% | 38% | 38% | 47% |
| Disapprove | 62% | 53% | 51% | 48% | 46% | 46% | 48% | 46% | 47% | 35% |
| (VOL) No opinion | 15% | 19% | 17% | 19% | 17% | 19% | 17% | 15% | 14% | 18% |
| (n) | (758) | (703) | (453) | (441) | (712) | (680) | (717) | (690) | (690) | (470) |
| Trend: Registered voters continued | Dec. 2013 | Sept. 2013 | April 2013 | Feb. 2013 | Dec. 2012 | Sept. 2012 | July 2012 | April 2012 | Feb. 2012 | Oct. 2011 | Aug. 2011 | May 2011 | Feb. 2011 | July 2010 | April 2010 | Feb. 2010 |
|---|---|---|---|---|---|---|---|---|---|---|---|---|---|---|---|---|
| Approve | 44% | 38% | 41% | 40% | 43% | 32% | 34% | 37% | 34% | 33% | 35% | 32% | 29% | 25% | 19% | 24% |
| Disapprove | 38% | 36% | 42% | 35% | 34% | 43% | 45% | 41% | 42% | 45% | 48% | 48% | 45% | 49% | 57% | 49% |
| (VOL) No opinion | 19% | 27% | 17% | 25% | 22% | 25% | 21% | 23% | 24% | 22% | 17% | 20% | 26% | 26% | 24% | 27% |
| (n) | (698) | (674) | (694) | (697) | (726) | (715) | (678) | (692) | (709) | (693) | (730) | (725) | (718) | (747) | (719) | (716) |
Trend: Registered voters continued | July 2009 | Feb. 2009 | Sept. 2008 | July 2008 | April 2008 | March 2008 | Oct. 2007 | Feb. 2007 |
|---|---|---|---|---|---|---|---|---|
| Approve | 31% | 23% | 29% | 27% | 28% | 25% | 32% | 34% |
| Disapprove | 48% | 55% | 50% | 47% | 55% | 53% | 43% | 42% |
| (VOL) No opinion | 22% | 22% | 21% | 26% | 17% | 22% | 25% | 23% |
| (n) | (792) | (721) | (709) | (889) | (720) | (719) | (688) | (681) |
[Q4 -13 previously released.]
[Q14 held for future release.]
15.I’d like to get your opinion on how Governor Murphy’s policies have affected different groups of New Jerseyans. Have his policies helped, hurt, or had no impact on [READ ITEM]? [ITEMS WERE ROTATED] [Note: In April 2018, poll question asked “how Governor Murphy’s policies will affect different groups…”]
Middle class residents
| Trend: | March 2024 | Aug. 2023 | April 2022 | May 2021 | Sept. 2019 | Feb. 2019 | April 2018 |
|---|---|---|---|---|---|---|---|
| Helped | 27% | 31% | 27% | 31% | 17% | 18% | 26% |
| Hurt | 47% | 44% | 38% | 36% | 31% | 39% | 41% |
| No impact | 19% | 19% | 27% | 25% | 36% | 27% | 17% |
| (VOL) Both helped and hurt | 1% | 2% | 2% | 2% | 2% | 1% | 2% |
| (VOL) Don’t know | 7% | 4% | 6% | 7% | 14% | 15% | 14% |
| (n) | (801) | (814) | (802) | (706) | (713) | (604) | (703) |
Poor residents
| Trend: | March 2024 | Aug. 2023 | April 2022 | May 2021 | Sept. 2019 | Feb. 2019 | April 2018 |
|---|---|---|---|---|---|---|---|
| Helped | 35% | 36% | 37% | 43% | 25% | 27% | 38% |
| Hurt | 33% | 32% | 28% | 22% | 21% | 28% | 29% |
| No impact | 20% | 19% | 22% | 22% | 32% | 27% | 14% |
| (VOL) Both helped and hurt | 0% | 3% | 1% | 1% | 1% | 1% | 2% |
| (VOL) Don’t know | 11% | 10% | 13% | 13% | 21% | 18% | 17% |
| (n) | (801) | (814) | (802) | (706) | (713) | (604) | (703) |
Wealthy residents
| Trend: | March 2024 | Aug. 2023 | April 2022 | May 2021 | Sept. 2019 | Feb. 2019 | April 2018 |
|---|---|---|---|---|---|---|---|
| Helped | 26% | 29% | 26% | 21% | 27% | 22% | 24% |
| Hurt | 21% | 19% | 21% | 21% | 14% | 21% | 29% |
| No impact | 36% | 35% | 37% | 38% | 31% | 30% | 30% |
| (VOL) Both helped and hurt | 0% | 3% | 1% | 1% | 1% | 1% | 1% |
| (VOL) Don’t know | 17% | 13% | 16% | 19% | 27% | 26% | 17% |
| (n) | (801) | (814) | (802) | (706) | (713) | (604) | (703) |
Property tax payers
| Trend: | March 2024 | Aug. 2023 | April 2022 | May 2021 | Sept. 2019 | Feb. 2019 | April 2018 |
|---|---|---|---|---|---|---|---|
| Helped | 24% | 23% | 13% | 14% | 10% | 6% | 17% |
| Hurt | 48% | 49% | 46% | 46% | 39% | 48% | 51% |
| No impact | 20% | 20% | 29% | 26% | 33% | 29% | 14% |
| (VOL) Both helped and hurt | 0% | 3% | 1% | 1% | 1% | 1% | 1% |
| (VOL) Don’t know | 8% | 5% | 11% | 13% | 17% | 16% | 17% |
| (n) | (801) | (814) | (802) | (706) | (713) | (604) | (703) |
Transit riders
| Trend: | March 2024 | Aug. 2023 | April 2022 | May 2021 | Sept. 2019 | Feb. 2019 | April 2018 |
|---|---|---|---|---|---|---|---|
| Helped | 19% | 26% | 20% | 24% | 16% | 14% | 28% |
| Hurt | 28% | 20% | 17% | 18% | 18% | 25% | 19% |
| No impact | 29% | 28% | 30% | 27% | 29% | 23% | 18% |
| (VOL) Both helped and hurt | 0% | 3% | 0% | 1% | 1% | 1% | 1% |
| (VOL) Don’t know | 24% | 23% | 32% | 30% | 35% | 37% | 34% |
| (n) | (801) | (814) | (802) | (706) | (713) | (604) | (703) |
Businesses
| Trend: | March 2024 | Aug. 2023 | April 2022 | May 2021 | Sept. 2019 | Feb. 2019 | April 2018 |
|---|---|---|---|---|---|---|---|
| Helped | 30% | 28% | 29% | 33% | 23% | 20% | 30% |
| Hurt | 39% | 38% | 38% | 39% | 26% | 33% | 33% |
| No impact | 18% | 20% | 18% | 15% | 26% | 24% | 15% |
| (VOL) Both helped and hurt | 0% | 4% | 1% | 3% | 1% | 1% | 1% |
| (VOL) Don’t know | 13% | 10% | 14% | 10% | 24% | 21% | 21% |
| (n) | (801) | (814) | (802) | (706) | (713) | (604) | (703) |
16.How much have you heard about Governor Murphy’s proposed state budget for the coming year, which he announced on Tuesday – a lot, a little, or nothing at all?
| Comparison: | March 2024 | April 2018* |
|---|---|---|
| A lot | 7% | 15% |
| A little | 38% | 55% |
| Nothing at all | 55% | 30% |
| (n) | (801) | (703) |
17.How would you describe your reaction to the governor’s budget plan – would you say you are satisfied with it, not particularly satisfied but you can live with it, or you are definitely dissatisfied with it?
| Comparison: | March 2024 | April 2018* |
|---|---|---|
| Satisfied | 5% | 9% |
| Can live with it | 19% | 29% |
| Dissatisfied | 16% | 23% |
| (VOL) Don’t know | 5% | 8% |
| Have not heard about (from Q16) | 55% | 30% |
| (n) | (801) | (703) |
18.Would you say Governor Murphy’s program priorities are in line with your own priorities for how the state spends its budget, are they too liberal for you, or are they not liberal enough for you?
| Response: | March 2024 |
|---|---|
| In line | 25% |
| Too liberal | 45% |
| Not liberal enough | 18% |
| (VOL) Don’t know | 12% |
| (n) | (801) |
19.In general, would you say Governor Murphy has done a good job or bad job managing New Jersey’s finances over the past six years?
| Response: | March 2024 |
|---|---|
| Good job | 53% |
| Bad job | 43% |
| (VOL) Don’t know | 5% |
| (n) | (801) |
20.How often do you use public transportation such as buses or trains – every day, several times a week, several times a month, a few times a year, less often, or never?
| Trend: | March 2024 | Dec. 2010 |
|---|---|---|
| Every day | 4% | 8% |
| Several times a week | 5% | 6% |
| Several times a month | 7% | 9% |
| A few times a year | 28% | 25% |
| Less often | 15% | 11% |
| Never | 40% | 41% |
| (VOL) Don’t know | 0% | 0% |
| (n) | (801) | (2,864) |
21.New Jersey Transit is the agency that runs most of the buses and trains in the state. Based on your own experience or from what you have heard, how would you rate the job New Jersey Transit is doing – excellent, good, only fair, or poor?
| Response: | March 2024 |
|---|---|
| Excellent | 6% |
| Good | 37% |
| Only fair | 35% |
| Poor | 12% |
| (VOL) Don’t know | 9% |
| (n) | (801) |
22.The governor has proposed a tax on businesses with profits over $10 million a year to create a dedicated fund to improve New Jersey Transit’s infrastructure and performance. Do you approve or disapprove of this tax proposal, or are you unsure about it?
| Response: | March 2024 |
|---|---|
| Approve | 40% |
| Disapprove | 28% |
| Unsure | 32% |
| (n) | (801) |
23.How confident are you that creating this dedicated fund will lead to significant improvements for New Jersey Transit – very confident, somewhat confident, not too confident, or not at all confident?
| Response: | March 2024 |
|---|---|
| Very confident | 6% |
| Somewhat confident | 35% |
| Not too confident | 26% |
| Not at all confident | 30% |
| (VOL) Don’t know | 3% |
| (n) | (801) |
[Q24-42 held for future release.]
METHODOLOGY
The Monmouth University Poll was sponsored and conducted by the Monmouth University Polling Institute from February 29 to March 4, 2024 with a probability-based random sample of 801 New Jersey adults age 18 and older. Interviews were conducted in English, and included 259 live landline telephone interviews, 375 live cell phone interviews, and 167 online surveys via a cell phone text invitation. Telephone numbers were selected through a mix of random digit dialing and list-based sampling. Landline respondents were selected with a modified Troldahl-Carter youngest adult household screen. Interviewing services were provided by Braun Research, with sample obtained from Dynata (RDD, n= 657) and Aristotle (list, n= 144). Monmouth is responsible for all aspects of the survey design, data weighting and analysis. The full sample is weighted for region, age, education, gender and race based on US Census information (ACS 2021 one-year survey. For results based on this sample, one can say with 95% confidence that the error attributable to sampling has a maximum margin of plus or minus 4.2 percentage points adjusted for sample design effects (1.49). Sampling error can be larger for sub-groups (see table below). In addition to sampling error, one should bear in mind that question wording and practical difficulties in conducting surveys can introduce error or bias into the findings of opinion polls.
NJ Regions (by county)
North – Bergen, Essex, Hudson, Morris, Passaic, Sussex, Union, Warren
Central – Hunterdon, Mercer, Middlesex, Monmouth, Somerset
South – Atlantic, Burlington, Camden, Cape May, Cumberland, Gloucester, Ocean, Salem
Demographics (weighted)
Party (self-reported): 26% Republican, 37% Independent, 37% Democrat
Sex: 49% male, 51% female, 1% other
Age: 28% 18-34, 33% 35-54, 39% 55+
Race: 55% White, 13% Black, 19% Hispanic, 13% Asian/other
Education: 34% high school or less, 25% some college, 23% 4 year degree, 18% graduate degree
Click on pdf file link below for full methodology and crosstabs by key demographic groups.


