
West Long Branch, NJ – Most residents value New Jersey’s racial and ethnic diversity, but hopefulness about the state of race relations has become more pessimistic over the past decade. As New Jersey and the nation prepares to honor the legacy of Martin Luther King, Jr. next week, the latest Monmouth (“Mon-muth”) University Poll of the Garden State also finds that the majority of New Jerseyans place a high value on the importance of interracial friendships. Among non-Hispanic whites, though, there is a significant partisan gap in opinion on questions of race.
Nearly 6 in 10 (59%) Garden State residents say the amount of racial and ethnic diversity in New Jersey is good for the state’s quality of life. Just 14% would characterize the state’s diversity as bad and 20% say diversity has no impact. On a related issue, 44% say that immigration into New Jersey has been good for the state, while 26% say it has been bad and 20% say it has had no impact. Both of these trends have steadily become more positive since 2010, when just 43% said the state’s diversity was a good thing and 34% said the same about immigration into New Jersey. Currently, 7 in 10 adults under 35 years old see New Jersey’s diversity as good for the state’s quality of life while just over half of those aged 35 and older feel the same. On the question of immigration, 60% of those aged 18 to 34, 46% of those aged 35 to 54, and 32% of those aged 55 and older see it as a net positive for the state.
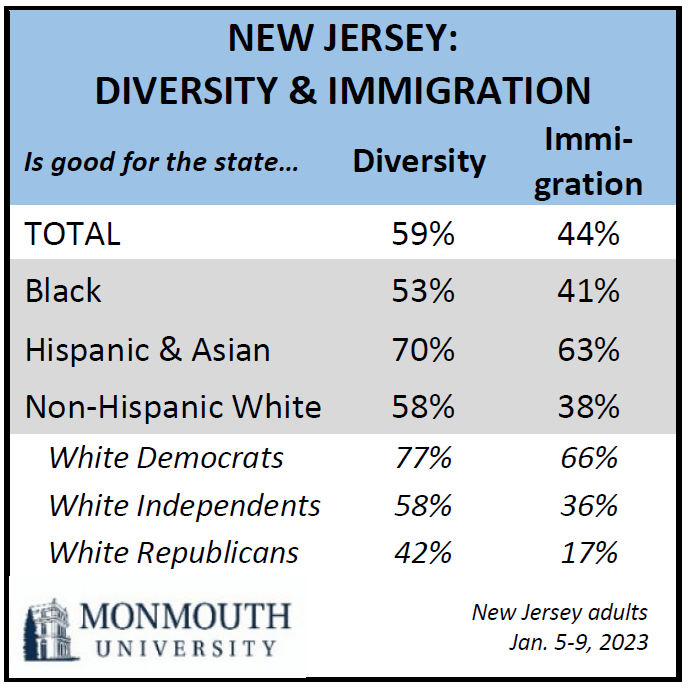
At first glance there appears to be little difference between the views of non-Hispanic white New Jerseyans (58%) and residents of other racial or Hispanic backgrounds (63%) on the state’s diversity being good for New Jersey’s quality of life. However, some differences emerge when drilling deeper into each group. Black residents (53%) are somewhat less positive than Hispanic and Asian residents (70%) about the value of the state’s diversity. Among white residents, those who identify with the Republican Party (42%) are much less positive than those who align with the Democrats (77%). There are similar demographic patterns on the impact of immigration as well. It’s worth noting that the adult population of New Jersey was about 63% non-Hispanic white when the 2010 poll was taken, but this figure is closer to 55% today. At the same time, the share of the state’s adult population that is Black has remained stable over the past decade while both the Hispanic and Asian populations have grown.
“As New Jersey has grown more diverse, residents seem to appreciate the positive impact of that diversity on life in the Garden State. Still, when they look at the world around them, most feel the nation is far from being an equitable society when it comes to matters of race,” said Patrick Murray, director of the independent Monmouth University Polling Institute.
Currently, just 1 in 4 (26%) New Jerseyans feel Black and white people are treated equally in our society. Another 27% believe they will see such equality in their lifetime, but 43% say they will not see racial equality in their lifetime. Public opinion was much more optimistic just over a decade ago in 2012, when 42% said that equal treatment of Blacks and whites was already a reality and just 1 in 4 (26%) believed it was out of reach. Current views about equality are also slightly worse than nearly twenty years ago (30% already equal and 41% out of reach in a 2004 Eagleton-Rutgers poll). There are no substantial age group differences on the level of opinion about the current or future state of race relations.
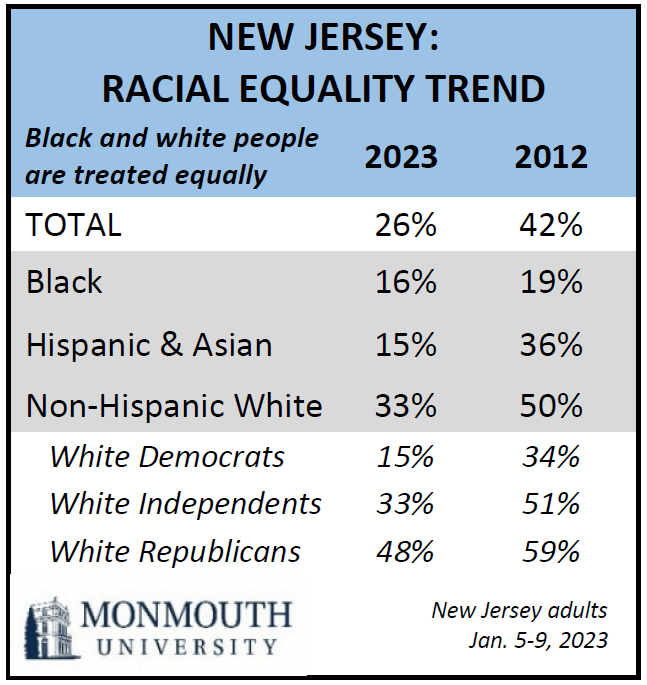
The decline in hopefulness has not occurred among Black residents, though, largely because their views a decade ago (19% already equal versus 51% will never see racial equality) were about the same as their current opinion (16% versus 56%). In 2012, other racial and ethnic groups were more positive than Black New Jerseyans about equality. Today, however, Hispanic and Asian residents are similarly pessimistic while non-Hispanic whites are only somewhat more hopeful. Among Hispanic and Asian residents, the belief that Blacks and whites are already treated equally has dropped from 36% in 2012 to 15% now, while the negative view that they will never see racial equality has increased from 22% to 51%. Among white New Jerseyans, the comparable trends are a drop from 50% to 33% for already equal and a rise from 22% to 35% for no racial equality in their lifetime.
The opinion of white New Jersey residents on this question is not monolithic, however. There is a clear partisan divide within this demographic. Among white Democrats, just 15% say the races are treated equally today and only 44% expect to see racial equality in their lifetime – views that are in line with the current opinions of Black, Hispanic, and Asian residents. White Democrats in New Jersey were somewhat more optimistic a decade ago (34% already equal versus 29% will never see racial equality). White Republicans in New Jersey remain the most positive about racial equality (48% already equal versus 31% will never see equality), but these numbers have also dropped since 2012 (59% versus 13%, respectively). Among white independents, views have also declined (33% already equal versus 31% will never see equality now, compared with 51% versus 24%, respectively in 2012).
“Optimism about the future of race relations appears to have peaked during the Obama years. It looks like we are back to where things stood at least two decades ago according to public opinion in New Jersey,” said Murray.
Taking a look at the issue closer to home, 64% of Garden State residents say that racial and ethnic discrimination is a problem in New Jersey – including 26% who say it is a big problem. In 2010, less than half (47%) saw discrimination in the state as a problem (including just 12% who said it was a big problem). The current results are closer to a Rutgers-Eagleton poll conducted back in 2001 (65% a problem, including 27% a big problem). Among those who say discrimination in New Jersey is a problem are 86% of Black residents, 67% of Hispanics and Asians, and 59% of non-Hispanic whites (ranging from 48% of white Republicans to 76% of white Democrats).
Public opinion on race relations is more positive when the focus is closer to home. Most New Jerseyans rate race relations in the area where they live as either excellent (23%) or good (53%). This positive opinion is held by just over 8 in 10 whites (with no significant differences by partisanship), 3 in 4 Hispanics and Asians, and 6 in 10 Black residents. These findings, including the demographic results, are basically unchanged from Monmouth’s 2012 poll.
When asked about people having close friends who are a different race from them, 44% of New Jerseyans see this as being very important and 33% say it is somewhat important. The number who see interracial friendships as very important has increased since 2012 (34%). About half of New Jerseyans under the age of 55 say interracial friendships are very important, while only one-third of those aged 55 and older feel the same. Currently, 57% of Black, Hispanic, and Asian residents say it is very important to have interracial friendships. Just 35% of non-Hispanic white New Jerseyans say the same, but this opinion actually ranges from just 22% among white Republicans (similar to 21% in 2012) to 52% among white Democrats (an increase from 37% in 2012).
“The opinion of white residents on issues of race is cast through a sometimes stark partisan lens – from the future of race relations to the importance of having interracial connections in one’s personal life. These results paint a telling picture of how race is such a defining feature of America’s current political divide,” said Murray.
The Monmouth University Poll was conducted by telephone from January 5 to 9, 2023 with 809 New Jersey adults. The question results in this release have a margin of error of +/- 4.7 percentage points for the full sample. The poll was conducted by the Monmouth University Polling Institute in West Long Branch, NJ.
QUESTIONS AND RESULTS
(* Some columns may not add to 100% due to rounding.)
[Q1 & 16-21 held for future release.]
[Q2-15 previously released.]
22.In general, do you feel that Black and white people are treated equally in our society, or not?
| Trend*: | Jan. 2023 | Feb. 2012 | Sept. 2010 | Jan. 2009 | Jan. 2004** |
|---|---|---|---|---|---|
| Yes | 26% | 42% | 40% | 38% | 30% |
| No | 68% | 50% | 54% | 53% | 65% |
| (VOL) Don’t know | 6% | 8% | 5% | 9% | 5% |
| (n) | (809) | (803) | (801) | (500) | (904) |
** Source: Eagleton-Rutgers Poll
23.Do you think you will see equal treatment for Black and white people in your lifetime, or not?
| Trend*: | Jan. 2023 | Feb. 2012 | Sept. 2010 | Jan. 2009 | Jan. 2004** |
|---|---|---|---|---|---|
| Already, equal (from Q22) | 26% | 42% | 40% | 38% | 30% |
| Yes | 27% | 27% | 21% | 29% | 26% |
| No | 43% | 26% | 35% | 25% | 41% |
| (VOL) Don’t know | 5% | 5% | 4% | 8% | 4% |
| (n) | (809) | (803) | (801) | (500) | (904) |
** Source: Eagleton-Rutgers Poll
24.Do you think that racial and ethnic discrimination in New Jersey is a problem, or not? [If YES: Is it a big problem, somewhat of a problem, or a small problem?]
| Trend: | Jan. 2023 | Dec. 2010 | Jan. 2009 | June 2007* | April 2001** | Aug. 1996* |
|---|---|---|---|---|---|---|
| Yes, big problem | 26% | 12% | 21% | 14% | 27% | 21% |
| Yes, somewhat of a problem | 32% | 28% | 27% | 30% | 31% | 40% |
| Yes, small problem | 6% | 7% | 9% | 11% | 7% | 6% |
| No, not a problem | 33% | 49% | 37% | 39% | 29% | 28% |
| (VOL) Don’t know | 2% | 4% | 6% | 6% | 6% | 5% |
| (n) | (809) | (2,864) | (500) | (1,279) | (802) | (1,203) |
** Source: Eagleton-Rutgers Poll
25.How would you rate relations between people of different races in the area where you live – excellent, good, only fair, or poor?
| Trend: | Jan. 2023 | Feb. 2012 | Dec. 2010 |
|---|---|---|---|
| Excellent | 23% | 26% | 12% |
| Good | 53% | 52% | 55% |
| Only fair | 18% | 17% | 22% |
| Poor | 5% | 3% | 7% |
| (VOL) Don’t know | 1% | 2% | 4% |
| (n) | (809) | (803) | (2,864) |
26.Is the amount of racial and ethnic diversity in New Jersey good or bad for the state’s quality of life, or does it have no impact?
| Trend: | Jan. 2023 | Feb. 2012 | Dec. 2010 |
|---|---|---|---|
| Good | 59% | 50% | 43% |
| Bad | 14% | 8% | 16% |
| No impact | 20% | 32% | 31% |
| (VOL) Both good and bad | 2% | 2% | 4% |
| (VOL) Don’t know | 5% | 7% | 6% |
| (n) | (809) | (803) | (2,864) |
27.Overall, do you feel that immigration into New Jersey has been good or bad for the state, or does it have no impact?
| Trend: | Jan. 2023 | May 2021 | Dec. 2010 |
|---|---|---|---|
| Good | 44% | 37% | 34% |
| Bad | 26% | 20% | 32% |
| No impact | 20% | 33% | 21% |
| (VOL) Both good and bad | 3% | 3% | 6% |
| (VOL) Don’t know | 7% | 6% | 7% |
| (n) | (809) | (706) | (2,864) |
28.How important is it that people have close friends who are a different race from them – very important, somewhat important, not too important, or not at all important?
| Trend: | Jan. 2023 | Feb. 2012 |
|---|---|---|
| Very important | 44% | 34% |
| Somewhat important | 33% | 38% |
| Not too important | 10% | 12% |
| Not at all important | 11% | 12% |
| (VOL) Don’t know | 2% | 3% |
| (n) | (809) | (803) |
[Q29-44 held for future release.]
Methodology
The Monmouth University Poll was sponsored and conducted by the Monmouth University Polling Institute from January 5 to 9, 2023 with a probability-based random sample of 809 New Jersey adults age 18 and older. This includes 286 contacted by a live interviewer on a landline telephone and 523 contacted by a live interviewer on a cell phone, in English. Telephone numbers were selected through random digit dialing and landline respondents were selected with a modified Troldahl-Carter youngest adult household screen. Monmouth is responsible for all aspects of the survey design, data weighting and analysis. The full sample is weighted for region, age, education, gender and race based on US Census information (ACS 2021 one-year survey). Interviewing services were provided by Braun Research, with sample obtained from Dynata. For results based on this sample, one can say with 95% confidence that the error attributable to sampling has a maximum margin of plus or minus 4.7 percentage points (adjusted for sample design effects). Sampling error can be larger for sub-groups (see table below). In addition to sampling error, one should bear in mind that question wording and practical difficulties in conducting surveys can introduce error or bias into the findings of opinion polls.
NJ Regions (by county)
North – Bergen, Essex, Hudson, Morris, Passaic, Sussex, Union, Warren
Central – Hunterdon, Mercer, Middlesex, Monmouth, Somerset
South – Atlantic, Burlington, Camden, Cape May, Cumberland, Gloucester, Ocean, Salem
| DEMOGRAPHICS (weighted) |
| Self-Reported |
| 23% Republican |
| 39% Independent |
| 38% Democrat |
| 49% Male |
| 51% Female |
| 27% 18-34 |
| 34% 35-54 |
| 39% 55+ |
| 55% White |
| 13% Black |
| 20% Hispanic |
| 12% Asian/Other |
| 59% No degree |
| 41% 4 year degree |
Click on pdf file link below for full methodology and crosstabs by key demographic groups.


