
West Long Branch, NJ – Joe Biden, Bernie Sanders, Pete Buttigieg, and Elizabeth Warren continue to jostle for the top spot in the fifth and final Monmouth University Poll of likely Iowa Democratic caucusgoers. Support for Amy Klobuchar registers in double digits and could have an impact on the leaderboard if she reaches the viability threshold in a number of precincts. About half of likely caucusgoers say they are still open to changing their minds when they show up to caucus on Monday.
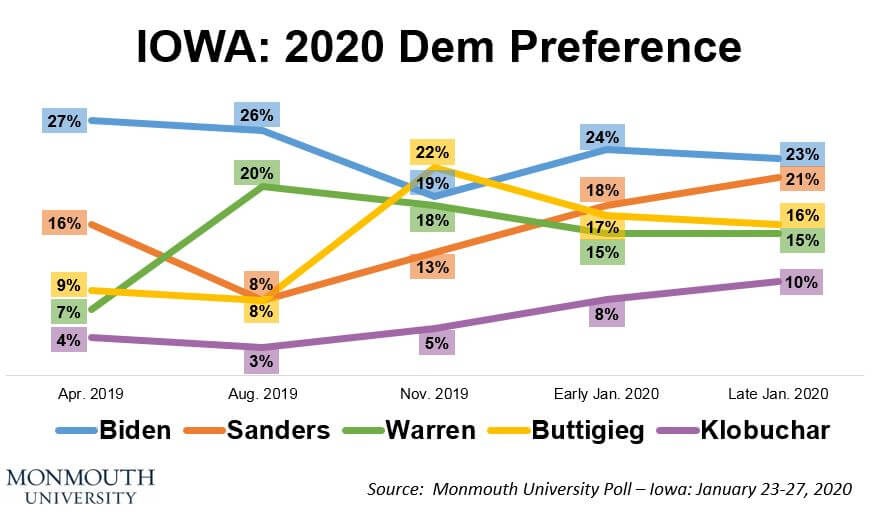
Four candidates remain in the top tier of likely caucusgoers’ first preference – Biden (23%), Sanders (21%), Buttigieg (16%), and Warren (15%). Klobuchar registers 10% support, while Tom Steyer earns 4% and Andrew Yang has 3%. Four other candidates earn 1% or less. [Note: Mike Bloomberg was not included in the poll because he is not participating in the Iowa caucus process.]
Changes from Monmouth’s poll earlier this month are not statistically significant. Two weeks ago, Biden had 24%, Sanders 18%, Buttigieg 17%, Warren 15%, and Klobuchar 8%. In terms of trajectory over Monmouth polls conducted since last summer, support for Biden has bounced around between 19% and 26%, Sanders has grown steadily from a low of 8% in August, Buttigieg jumped from 8% to 22% between August and November but has fallen back from that high point, Warren has slipped slightly from 20% in the summer, and Klobuchar has inched up from 3% in August.
“Caucus electorates are the most difficult to model in polling. The smartest takeaway from this, or any Iowa poll for that matter, is to be prepared for anything on Monday,” said Patrick Murray, director of the independent Monmouth University Polling Institute.
There has not been a large increase in the number of voters who have settled on a candidate in the past few weeks. Currently, 47% of likely Iowa caucusgoers are firmly decided on their candidate choice. That hasn’t changed much from Monmouth’s poll two weeks ago when firm support stood at 43%. Nearly half (45%) say they are open to switching support on caucus night, including 13% who rate this as a high possibility, 23% a moderate possibility, and 9% a low possibility. Firm support for the top polling candidates ranges from 47% for Klobuchar, 48% for Biden, and 49% for Buttigieg to 55% for Warren and 58% for Sanders.
The poll asked caucusgoers to name a candidate they have in mind as a second choice. When these are combined with initial preferences, Biden (39%), Warren (34%), Sanders (32%), and Buttigieg (29%) are bunched together. They are trailed by Klobuchar (22%), Steyer (10%), and Yang (7%) as either a first or second choice. These numbers have not changed much since earlier this month.
A key factor in how these second choices will play out, though, is determined by whose supporters will need to realign if their first choice does not reach the 15% viability threshold for convention delegates. If Klobuchar and Yang remain viable in some precincts, the race remains tight. A hypothetical six candidate field puts the race at 22% Biden, 22% Sanders, 17% Buttigieg, 16% Warren, 12% Klobuchar, and 5% Yang.
If viability comes down to just the top four candidates, though, the race is still tight but Biden appears to benefit slightly more. When likely caucusgoers are asked to choose from among this limited field, the race stands at 29% Biden, 25% Sanders, 20% Buttigieg, and 19% Warren. In this scenario, about 4 in 10 Klobuchar supporters would realign with Biden, while about 1 in 4 would go to Buttigieg, 1 in 5 to Warren, and just a handful to Sanders.
“Klobuchar’s performance could be a real game changer in the final delegate allocation out of Iowa,” said Murray.
Small shifts in who turns out to caucus can also have a large impact on the outcome. Caucus turnout represents only a small proportion of eligible voters and varies widely from cycle to cycle. According to the Iowa Democratic Party, the 2016 caucuses drew just over 170,000 voters. This is lower than the record turnout of nearly 240,000 caucusgoers in 2008, but higher than the prior contested contest (124,000 in 2004). On average, less than one-third of registered Democrats (about 614,000 currently) participate in the presidential caucuses. The actual turnout rate is lower since non-Democrats can also show up and change their party registration at the caucus site.
Monmouth’s estimate of the current state of the race assumes a caucus turnout similar to 2008’s high. This is based on the number of potential voters contacted for the poll who screened through as likely caucusgoers. Monmouth also examined what the race could potentially look like under different turnout scenarios. An electorate that includes higher numbers of traditional Democratic primary voters could increase Biden’s lead to as much as 6 points. On the other hand, a caucus electorate that is more heavily populated by voters who do not participate in primary elections could result in a Sanders lead of about 4 points.
These different turnout scenarios were calculated by adjusting the sample’s composition based on past voting behavior according to state voter rolls. The only demographic variable that ends up shifting under these propensity-based models is age (gender, race, and education remain stable). Furthermore, these alternate turnout scenarios have the largest impact on support for Sanders, varying his vote share by as much as 5 points from Monmouth’s benchmark measure of 21% reported in this release (range of 19-26%). None of the other candidates’ support levels vary by more than a couple of points under any of these scenarios (ranges for Biden 22-25%, Buttigieg 15-17%, Warren 13-16%, and Klobuchar 9-10%).
“A turnout swing of as few of 10,000 voters could determine who ‘wins’ the caucus if it is driven by a specific demographic group,” said Murray.
The Monmouth University Poll also finds that candidate favorability ratings have seen only small movements over the past two weeks, with one exception. Warren tops the ratings at 71% favorable and 21% unfavorable, followed by Buttigieg (68%-19%), Biden (68%-22%), Klobuchar (63%-18%), Yang (60%-17%), and Sanders (61%-32%). Steyer has a 50%-28% rating. Sanders has dropped from his high watermark of 70% favorable and 22% unfavorable earlier this month. His current rating is more in line with Iowa voter opinion last summer and fall.
| 2020 DEMOCRATIC FIELD – IOWA PARTY VOTER OPINION Net Rating (favorable – unfavorable) | |||||
|
Late Jan. ’20 |
Early Jan. ’20 | Nov. ’19 | Aug. ’19 | Apr. ’19 | |
| Elizabeth Warren | +50 | +54 | +46 | +62 | +47 |
| Pete Buttigieg | +49 | +54 | +63 | +63 | +36 |
| Joe Biden | +46 | +38 | +39 | +52 | +64 |
| Amy Klobuchar | +45 | +47 | +36 | +33 | +41 |
| Andrew Yang | +43 | +37 | +15 | n/a | +6 |
| Bernie Sanders | +29 | +48 | +32 | +25 | +41 |
| Tom Steyer | +22 | +14 | +4 | +8 | n/a |
The Monmouth University Poll was conducted by telephone from January 23 to 27, 2020 with 544 Iowa voters who are likely to attend the Democratic presidential caucuses in February 2020, out of 1,345 registered Democrats and unaffiliated voters who were contacted for the poll. The question results in this release have a margin of error of +/- 4.2 percentage points. The poll was conducted by the Monmouth University Polling Institute in West Long Branch, NJ. Please note that the trend numbers for the August poll were rebased to exclude voters who would only attend a “virtual” caucus (which is no longer an option).
QUESTIONS AND RESULTS
(* Some columns may not add to 100% due to rounding.)
1. If the Democratic caucuses for president were today, would you support – [NAMES WERE ROTATED]? [If UNDECIDED: If you had to support one of these candidates at this moment, who do you lean toward?]
| TREND: (with leaners) |
Late Jan. 2020 | Early Jan. 2020 | Nov. 2019 | Aug. 2019** | April 2019 |
| Joe Biden | 23% | 24% | 19% | 26% | 27% |
| Bernie Sanders | 21% | 18% | 13% | 8% | 16% |
| Pete Buttigieg | 16% | 17% | 22% | 8% | 9% |
| Elizabeth Warren | 15% | 15% | 18% | 20% | 7% |
| Amy Klobuchar | 10% | 8% | 5% | 3% | 4% |
| Tom Steyer | 4% | 4% | 3% | 3% | n/a |
| Andrew Yang | 3% | 3% | 3% | 1% | 1% |
| Michael Bennet | 1% | <1% | <1% | <1% | 0% |
| Tulsi Gabbard | 1% | 2% | 2% | 1% | <1% |
| Deval Patrick | <1% | 0% | n/a | n/a | n/a |
| John Delaney | 0% | <1% | <1% | 1% | 1% |
| (VOL) Other | <1% | 4%* | 7%* | 18%* | 22%* |
| (VOL) No one | 0% | 0% | 0% | <1% | 1% |
| (VOL) Undecided | 5% | 5% | 8% | 10% | 12% |
| (n) | (544) | (405) | (451) | (327) | (351) |
* Includes candidates who have since dropped out.
**Excludes “virtual-only” caucus attendees from August poll.
2. Are you firmly decided on your candidate choice or are you open to the possibility of supporting a different candidate on caucus night? [If OPEN: Would you rate the possibility of supporting a different candidate as high, moderate, or low?]
| TREND: | Late Jan. 2020 | Early Jan. 2020 | Nov. 2019 |
| Firmly decided | 47% | 43% | 28% |
| Open, high possibility | 13% | 11% | 16% |
| Open, moderate possibility | 23% | 28% | 37% |
| Open, low possibility | 9% | 13% | 8% |
| (VOL) Don’t know | 3% | 1% | 2% |
| No first choice (from Q1) | 5% | 5% | 8% |
| (n) | (544) | (405) | (451) |
3. Who would be your second choice if you had to make one?
|
TREND: | Late Jan. 2020 | Early Jan. 2020 | Nov. 2019 | Aug. 2019** | April 2019 |
| Elizabeth Warren | 19% | 23% | 17% | 18% | 10% |
| Joe Biden | 16% | 10% | 10% | 12% | 12% |
| Pete Buttigieg | 13% | 15% | 15% | 10% | 6% |
| Amy Klobuchar | 12% | 10% | 9% | 2% | 3% |
| Bernie Sanders | 11% | 14% | 12% | 7% | 8% |
| Tom Steyer | 6% | 4% | 3% | 3% | n/a |
| Andrew Yang | 4% | 4% | 1% | 2% | <1% |
| Tulsi Gabbard | 2% | 1% | 1% | 2% | 2% |
| Michael Bennet | 1% | 0% | <1% | <1% | 0% |
| John Delaney | <1% | <1% | 0% | 1% | <1% |
| Deval Patrick | 0% | 0% | n/a | n/a | n/a |
| (VOL) Other | <1% | 3%* | 11%* | 26%* | 32%* |
| (VOL) No one | 2% | 6% | 3% | 3% | 10% |
| (VOL) Undecided | 13% | 10% | 19% | 18% | 18% |
| (n) | (544) | (405) | (451) | (327) | (351) |
* Includes candidates who have since dropped out.
**Excludes “virtual-only” caucus attendees from August poll.
4. If the only viable candidates in your caucus site were the following six people who would you caucus for? [NAMES WERE ROTATED]
| Late Jan. 2020 | |
| Joe Biden | 22% |
| Bernie Sanders | 22% |
| Pete Buttigieg | 17% |
| Elizabeth Warren | 16% |
| Amy Klobuchar | 12% |
| Andrew Yang | 5% |
| (VOL) None of these/won’t caucus | <1% |
| (VOL) Undecided | 6% |
| (n) | (544) |
5. If the only viable candidates in your caucus site were the following four people who would you caucus for? [NAMES WERE ROTATED]
|
TREND: |
Late Jan. 2020 |
Early Jan. 2020 |
| Joe Biden | 29% | 28% |
| Bernie Sanders | 25% | 24% |
| Pete Buttigieg | 20% | 25% |
| Elizabeth Warren | 19% | 16% |
| (VOL) None of these/won’t caucus | 1% | 2% |
| (VOL) Undecided | 6% | 4% |
| (n) | (544) | (405) |
6. I’m going to read you the names of some people who are running for president in 2020. Please tell me if your general impression of each is favorable or unfavorable, or if you don’t really have an opinion. If you have not heard of the person, just let me know. [NAMES WERE ROTATED]
|
TREND: | Favorable | Unfavorable | No opinion | Not heard of | (n) |
| Former Vice President Joe Biden | 68% | 22% | 10% | 0% | (544) |
| — Early January 2020 | 66% | 28% | 6% | 0% | (405) |
| — November 2019 | 65% | 26% | 9% | 0% | (451) |
| — August 2019* | 72% | 20% | 8% | 0% | (327) |
| — April 2019 | 78% | 14% | 8% | 0% | (351) |
| Vermont Senator Bernie Sanders | 61% | 32% | 7% | 0% | (544) |
| — Early January 2020 | 70% | 22% | 8% | 0% | (405) |
| — November 2019 | 61% | 29% | 10% | 0% | (451) |
| — August 2019* | 58% | 33% | 9% | 0% | (327) |
| — April 2019 | 67% | 26% | 6% | 0% | (351) |
| Massachusetts Senator Elizabeth Warren | 71% | 21% | 8% | 1% | (544) |
| — Early January 2020 | 73% | 19% | 8% | 1% | (405) |
| — November 2019 | 69% | 23% | 8% | 0% | (451) |
| — August 2019* | 76% | 14% | 8% | 1% | (327) |
| — April 2019 | 67% | 20% | 11% | 3% | (351) |
| Minnesota Senator Amy Klobuchar | 63% | 18% | 17% | 2% | (544) |
| — Early January 2020 | 63% | 16% | 14% | 8% | (405) |
| — November 2019 | 54% | 18% | 22% | 6% | (451) |
| — August 2019* | 51% | 18% | 26% | 5% | (327) |
| — April 2019 | 51% | 10% | 23% | 16% | (351) |
| Former South Bend, Indiana Mayor Pete Buttigieg | 68% | 19% | 13% | 1% | (544) |
| — Early January 2020 | 71% | 17% | 9% | 3% | (405) |
| — November 2019 | 73% | 10% | 14% | 3% | (451) |
| — August 2019* | 72% | 9% | 15% | 4% | (327) |
| — April 2019 | 45% | 9% | 22% | 24% | (351) |
| Entrepreneur Andrew Yang | 60% | 17% | 21% | 3% | (544) |
| — Early January 2020 | 57% | 20% | 20% | 3% | (405) |
| — November 2019 | 39% | 24% | 29% | 7% | (451) |
| — August 2019* | n/a | n/a | n/a | n/a | n/a |
| — April 2019 | 15% | 9% | 34% | 42% | (351) |
| Former hedge fund manager Tom Steyer | 50% | 28% | 21% | 1% | (544) |
| — Early January 2020 | 46% | 32% | 22% | 1% | (405) |
| — November 2019 | 33% | 29% | 30% | 8% | (451) |
| — August 2019* | 33% | 25% | 26% | 15% | (327) |
| — April 2019 | n/a | n/a | n/a | n/a | n/a |
* Excludes “virtual-only” caucus attendees from August poll.
7. Will this be your first presidential caucus or have you attended the Iowa presidential caucuses in the past? [If ATTENDED IN PAST: Was that a Republican or a Democratic caucus, or both?]
| TREND: |
Late Jan. 2020 |
Early Jan. 2020 | Nov. 2019 | Aug. 2019* |
| First caucus | 21% | 17% | 14% | 9% |
| Attended Republican caucus in past | 2% | 1% | 2% | 1% |
| Attended Democratic caucus in past | 68% | 69% | 73% | 80% |
| Attended both caucuses in the past | 8% | 12% | 11% | 10% |
| (VOL) Don’t Know | 0% | 1% | 1% | 1% |
| (n) | (544) | (405) | (451) | (327) |
* Excludes “virtual-only” caucus attendees from August poll.
METHODOLOGY
The Monmouth University Poll was sponsored and conducted by the Monmouth University Polling Institute from January 23 to 27, 2020 with a statewide random sample of 1,345 Iowa voters drawn from a list of registered Democratic and unaffiliated voters who voted in at least one of the last two state primary elections or the 2018 general election or have registered to vote since November 2018. This includes 656 contacted by a live interviewer on a landline telephone and 689 contacted by a live interviewer on a cell phone, in English. Results are based on 544 voters who are likely to attend the Democratic presidential caucuses in February 2020. Monmouth is responsible for all aspects of the survey design, data weighting and analysis. The full sample is weighted for age, gender, race, and education based on state voter registration list and U.S. Census information (CPS 2018 supplement). Data collection support provided by Braun Research (field) and Aristotle (voter sample). For results based on the sample of likely Democratic caucusgoers, one can say with 95% confidence that the error attributable to sampling has a maximum margin of plus or minus 4.2 percentage points (unadjusted for sample design). Sampling error can be larger for sub-groups (see table below). In addition to sampling error, one should bear in mind that question wording and practical difficulties in conducting surveys can introduce error or bias into the findings of opinion polls.
| DEMOGRAPHICS (weighted) |
| 42% Male |
| 58% Female |
| 19% 18-34 |
| 21% 35-49 |
| 32% 50-64 |
| 28% 65+ |
| 91% White, non-Hispanic |
| 9% Other race, Hispanic |
| 57% No degree |
| 43% 4 year degree |
Click on pdf file link below for full methodology and results by key demographic groups.