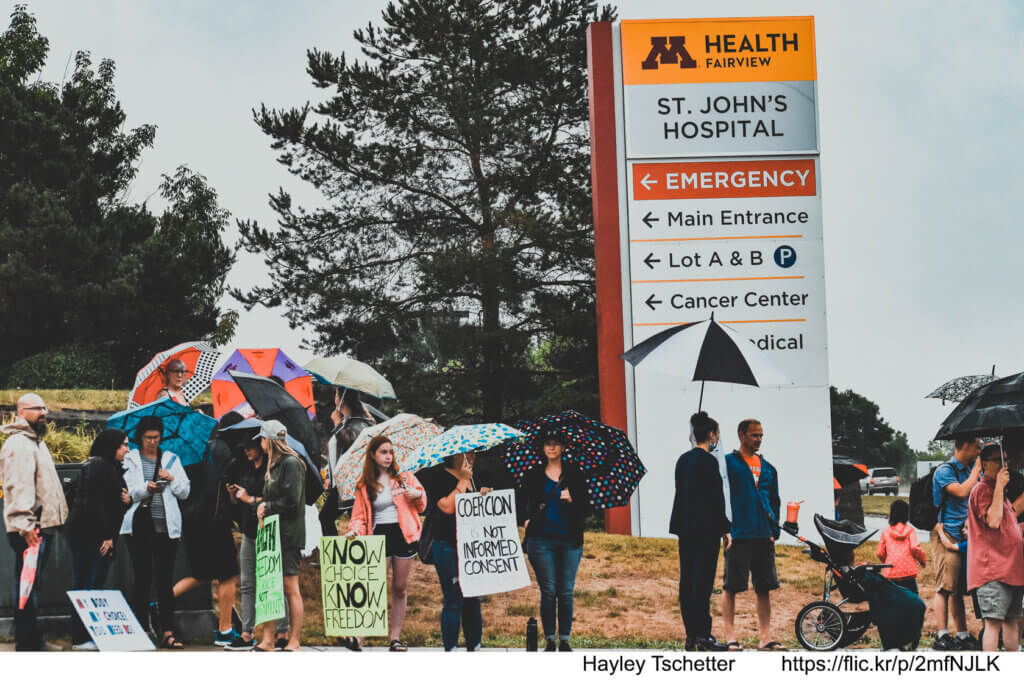
West Long Branch, NJ – Despite intense protests at board of education meetings, Covid vaccine and mask mandates in the nation’s schools remain popular with a majority of Americans. The Monmouth (“Mon-muth”) University Poll also finds stable support for vaccine requirements for health care workers and air travel but declining support for requiring proof of vaccination to eat in a restaurant. President Joe Biden continues to get a thumbs-up from most Americans for his handling the pandemic.
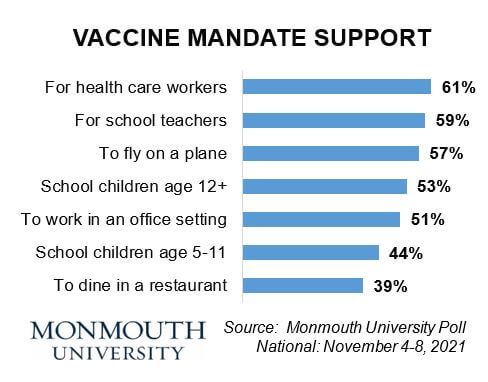
The poll finds 61% of the public supports requiring face masks to be worn in schools by students, teachers, and staff. This is down slightly from September (66%). Support levels for school-based vaccine mandates remain stable for both teachers and staff (59%, compared to 60% in September) and students age 12 and older (53%, compared to 51% in September). Among parents, 60% support school mask mandates and 52% support teacher vaccine mandates, but just 40% support vaccine mandates for older students. These numbers have not changed by more than two percentage points since Monmouth’s September poll. The current poll also finds less than half (44%) of the public – and just 34% of parents – supports requiring vaccines for students in the newly eligible 5 to 11 age group.
“The dramatic images of parents protesting at school board meetings has not shifted overall public opinion on mandates one way or the other since the beginning of the school year,” said Patrick Murray, director of the independent Monmouth University Polling Institute.
Opinion on vaccine mandates in other settings has not shifted much in the past two months, including requiring the Covid shot for health care workers (61%), requiring proof of vaccination to fly on an airplane (57%), and requiring vaccination in order to go to work in an office setting (51%). Each of these results is down just two percentage points from Monmouth’s September poll. The one exception is support for requiring proof of vaccination to dine inside a restaurant (39%), which has dropped by 7 points since September.
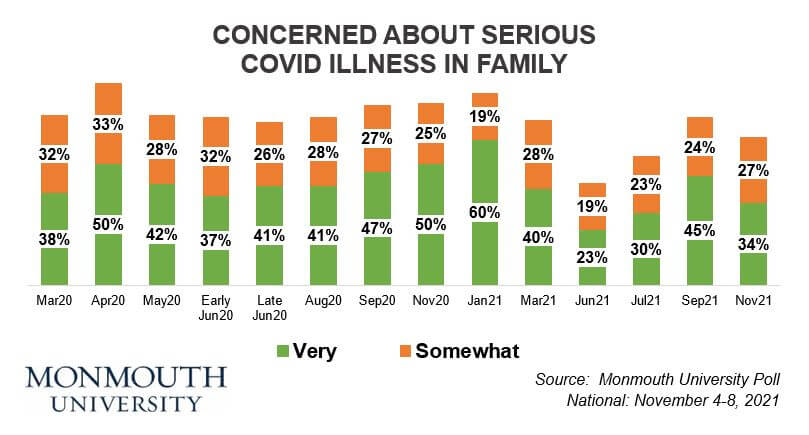
Concerns about contracting Covid have declined slightly after swinging upward earlier in the fall as the delta variant spread. Currently, 1 in 3 (34%) American adults are very concerned about a family member becoming seriously ill from the coronavirus. This number is down from 45% in September, which was a jump from the pandemic-era low of 23% recorded in June. The high point for this metric was 60% in January.
Currently, 80% of adults report having received at least one dose of Covid vaccine. About half have either gotten a booster shot (10%) or are very likely to get one (41%). This combined number is practically identical to 52% in September who said they would be very likely to get a booster shot if it became available. However, 13% of the public – about 3 in 4 of whom identify with or lean toward the Republican Party – remains opposed to getting the vaccine at all.
In other poll findings, a majority of Americans (53%) continue to say President Biden has done a good job handling the pandemic. This is similar to his 52% positive rating on Covid in September, even though his overall job approval rating slipped from 46% to 42% during the same time.
Ratings for federal health agencies’ handling of the pandemic have also been stable (53% good job, compared to 52% in September) while ratings for state governors have ticked up (60% good job, compared to 56% in September). Ratings for how the American public is dealing with the pandemic have improved, but still remain largely negative at 35% good job (23% in September) and 55% bad job (65% in September).
The Monmouth University Poll was conducted by telephone from November 4 to 8, 2021 with 811 adults in the United States. The question results in this release have a margin of error of +/- 3.5 percentage points. The poll was conducted by the Monmouth University Polling Institute in West Long Branch, NJ.
QUESTIONS AND RESULTS
(* Some columns may not add to 100% due to rounding.)
[Q1-16 & Q24A/B previously released.]
[Q17-23 & Q25-27 held for future release.]
28.How concerned are you about someone in your family becoming seriously ill from the coronavirus outbreak – very concerned, somewhat concerned, not too concerned, or not at all concerned?
| TREND: | Nov. 2021 | Sept. 2021 | July 2021 | June 2021 | March 2021 | Jan. 2021 | Nov. 2020 | Early Sept. 2020 | Aug. 2020 | Late June 2020 | Early June 2020 | May 2020 | April 2020 | March 2020 |
| Very concerned | 34% | 45% | 30% | 23% | 40% | 60% | 50% | 47% | 41% | 41% | 37% | 42% | 50% | 38% |
| Somewhat concerned | 27% | 24% | 23% | 19% | 28% | 19% | 25% | 27% | 28% | 26% | 32% | 28% | 33% | 32% |
| Not too concerned | 22% | 17% | 21% | 24% | 14% | 12% | 13% | 13% | 18% | 17% | 14% | 14% | 9% | 18% |
| Not at all concerned | 15% | 12% | 24% | 32% | 16% | 7% | 10% | 12% | 13% | 15% | 16% | 16% | 7% | 12% |
| (VOL) Don’t know | 1% | 1% | 0% | 1% | 0% | 0% | 0% | 0% | 0% | 0% | 0% | 0% | 0% | 0% |
| (VOL) Has already happened | 1% | 1% | 2% | 1% | 2% | 2% | 1% | 0% | 1% | 1% | 0% | 0% | 0% | n/a |
| (n) | (811) | (802) | (804) | (810) | (802) | (809) | (810) | (867) | (868) | (867) | (807) | (808) | (857) | (851) |
29.Please tell me if each of the following has done a good job or bad job dealing with the coronavirus outbreak. [ITEMS WERE ROTATED]
| TREND: | Good Job | Bad Job | (VOL) Mixed, depends | (VOL) Don’t know | (n) |
| President Biden | 53% | 41% | 2% | 3% | (811) |
| — September 2021 | 52% | 43% | 4% | 1% | (802) |
| — July 2021 | 55% | 38% | 4% | 3% | (804) |
| — June 2021 | 59% | 32% | 4% | 5% | (810) |
| — April 2021 | 62% | 31% | 3% | 3% | (800) |
| — March 2021 | 57% | 31% | 3% | 8% | (802) |
| — January 2021 | 58% | 23% | 5% | 15% | (809) |
| Your state’s governor | 60% | 35% | 3% | 3% | (811) |
| — September 2021 | 56% | 38% | 3% | 3% | (802) |
| — July 2021 | 54% | 42% | 3% | 2% | (804) |
| — June 2021 | 58% | 33% | 5% | 4% | (810) |
| — April 2021 | 62% | 34% | 3% | 2% | (800) |
| — March 2021 | 56% | 38% | 3% | 2% | (802) |
| — January 2021 | 57% | 38% | 3% | 2% | (809) |
| — Early September 2020 | 61% | 35% | 3% | 1% | (867) |
| — August 2020 | 57% | 35% | 5% | 3% | (868) |
| — Late June 2020 | 65% | 28% | 5% | 2% | (867) |
| — Early June 2020 | 67% | 28% | 3% | 1% | (807) |
| — May 2020 | 73% | 22% | 3% | 2% | (808) |
| — April 2020 | 72% | 21% | 4% | 3% | (857) |
| — March 2020 | 72% | 18% | 4% | 6% | (851) |
| The American public | 35% | 55% | 7% | 3% | (811) |
| — September 2021 | 23% | 65% | 10% | 2% | (802) |
| — July 2021 | 32% | 51% | 12% | 5% | (804) |
| — June 2021 | 42% | 40% | 14% | 4% | (810) |
| — April 2021 | 43% | 44% | 10% | 4% | (800) |
| — March 2021 | 35% | 53% | 11% | 1% | (802) |
| — January 2021 | 32% | 60% | 6% | 2% | (809) |
| — Early September 2020 | 31% | 57% | 10% | 2% | (867) |
| — August 2020 | 26% | 62% | 11% | 1% | (868) |
| — Late June 2020 | 28% | 59% | 11% | 3% | (867) |
| — Early June 2020 | 46% | 43% | 8% | 2% | (807) |
| — May 2020 | 51% | 33% | 13% | 2% | (808) |
| — April 2020 | 38% | 48% | 12% | 2% | (857) |
| — March 2020 | 38% | 45% | 14% | 3% | (851) |
| Health agencies in the federal government | 53% | 38% | 5% | 4% | (811) |
| — September 2021 | 52% | 38% | 6% | 3% | (802) |
| — July 2021 | 57% | 33% | 7% | 3% | (804) |
| — June 2021 | 55% | 33% | 6% | 5% | (810) |
| — April 2021 | n/a | n/a | n/a | n/a | n/a |
| — March 2021 | 50% | 37% | 8% | 5% | (802) |
| — January 2021 | 52% | 40% | 6% | 3% | (809) |
| — Early September 2020 | n/a | n/a | n/a | n/a | n/a |
| — August 2020 | 46% | 43% | 6% | 4% | (868) |
| — Late June 2020 | n/a | n/a | n/a | n/a | n/a |
| — Early June 2020 | 57% | 34% | 5% | 3% | (807) |
| — May 2020 | 63% | 25% | 7% | 4% | (808) |
| — April 2020 | 66% | 25% | 4% | 4% | (857) |
| — March 2020 | 65% | 24% | 8% | 4% | (851) |
30.Have you received at least one dose of Covid vaccine, or not?[If NOT:] Do you plan to get the Covid vaccine as soon as possible, will you continue to let other people get it first to see how it goes, or is it likely you will never get the vaccine if you can avoid it?
| TREND: | Nov. 2021 | Sept. 2021 | July 2021 | June 2021 | April 2021 | March 2021 | Jan. 2021 |
| Already received vaccine | 80% | 75% | 68% | 66% | 51% | 16%* | 6%* |
| As soon as possible | 1% | 2% | 2% | 2% | 14% | 38% | 50% |
| See how it goes | 4% | 6% | 9% | 9% | 12% | 21% | 19% |
| Likely will never get vaccine | 13% | 15% | 17% | 21% | 21% | 24% | 24% |
| (VOL) Don’t know | 3% | 2% | 4% | 2% | 2% | 1% | 2% |
| (n) | (811) | (802) | (804) | (810) | (800) | (802) | (809) |
* January/March 2021 polls did not specifically ask if person already got the vaccine, but included it as a volunteered response.
31.How likely are you to get a booster shot of the vaccine – very likely, somewhat likely, not too likely, or not at all likely?
| TREND: | Nov. 2021 | Sept. 2021* |
| Very likely | 41% | 51% |
| Somewhat likely | 14% | 16% |
| Not too likely | 8% | 6% |
| Not at all likely | 9% | 9% |
| (VOL) Have already gotten one | 10% | 1% |
| (VOL) Don’t know | 2% | 1% |
| Likely will never get vaccine (from Q30) | 16% | 17% |
| (n) | (811) | (802) |
* September 2021 question included “…if it is made available.”
32.Do you support or oppose requiring that face masks be worn by students, teachers, and staff in schools in your state?
| TREND: | Nov. 2021 | Sept. 2021 |
| Support | 61% | 66% |
| Oppose | 34% | 32% |
| (VOL) Depends | 3% | 1% |
| (VOL) Don’t know | 2% | 1% |
| (n) | (811) | (802) |
33.Do you support or oppose requiring school teachers and staff to get the Covid vaccine?
| TREND: | Nov. 2021 | Sept. 2021 |
| Support | 59% | 60% |
| Oppose | 38% | 36% |
| (VOL) Depends | 2% | 3% |
| (VOL) Don’t know | 1% | 1% |
| (n) | (811) | (802) |
34.Do you support or oppose requiring children who are age 12 and older to get the Covid vaccine in order to attend school in person?
| TREND: | Nov. 2021 | Sept. 2021 |
| Support | 53% | 51% |
| Oppose | 43% | 44% |
| (VOL) Depends | 2% | 3% |
| (VOL) Don’t know | 2% | 2% |
| (n) | (811) | (802) |
35.Do you support or oppose requiring children who are between the ages of 5 and 11 to get the Covid vaccine in order to attend school in person?
| Nov. 2021 | |
| Support | 44% |
| Oppose | 51% |
| (VOL) Depends | 2% |
| (VOL) Don’t know | 3% |
| (n) | (811) |
36.Do you support or oppose requiring health care workers to get the Covid vaccine?
| TREND: | Nov. 2021 | Sept. 2021 |
| Support | 61% | 63% |
| Oppose | 36% | 36% |
| (VOL) Depends | 1% | 1% |
| (VOL) Don’t know | 1% | 1% |
| (n) | (811) | (802) |
[QUESTIONS 37-39 WERE ROTATED]
37.Do you support or oppose requiring people to show proof of vaccination in order to go to work in an office or setting where they are around other people?
| TREND: | Nov. 2021 | Sept. 2021 |
| Support | 51% | 53% |
| Oppose | 47% | 45% |
| (VOL) Depends | 2% | 2% |
| (VOL) Don’t know | 1% | 1% |
| (n) | (811) | (802) |
38.Do you support or oppose requiring people to show proof of vaccination in order to fly on a plane?
| TREND: | Nov. 2021 | Sept. 2021 |
| Support | 57% | 59% |
| Oppose | 40% | 40% |
| (VOL) Depends | 1% | 1% |
| (VOL) Don’t know | 2% | 1% |
| (n) | (811) | (802) |
39.Do you support or oppose requiring people to show proof of vaccination in order to dine inside a restaurant?
| TREND: | Nov. 2021 | Sept. 2021 |
| Support | 39% | 46% |
| Oppose | 58% | 51% |
| (VOL) Depends | 1% | 2% |
| (VOL) Don’t know | 2% | 1% |
| (n) | (811) | (802) |
[Q40-44 held for future release.]
METHODOLOGY
The Monmouth University Poll was sponsored and conducted by the Monmouth University Polling Institute from November 4 to 8, 2021 with a national random sample of 811 adults age 18 and older. This includes 283 contacted by a live interviewer on a landline telephone and 528 contacted by a live interviewer on a cell phone, in English. Telephone numbers were selected through a mix of random digit dialing and list-based sampling. Landline respondents were selected with a modified Troldahl-Carter youngest adult household screen. Monmouth is responsible for all aspects of the survey design, data weighting and analysis. The full sample is weighted for region, age, education, gender and race based on US Census information (ACS 2018 one-year survey). Data collection support provided by Braun Research (field), Dynata (RDD sample), and Aristotle (list sample). For results based on this sample, one can say with 95% confidence that the error attributable to sampling has a maximum margin of plus or minus 3.5 percentage points (unadjusted for sample design). Sampling error can be larger for sub-groups (see table below). In addition to sampling error, one should bear in mind that question wording and practical difficulties in conducting surveys can introduce error or bias into the findings of opinion polls.
| DEMOGRAPHICS (weighted) |
| Self-Reported |
| 27% Republican |
| 43% Independent |
| 31% Democrat |
| 49% Male |
| 51% Female |
| 30% 18-34 |
| 32% 35-54 |
| 38% 55+ |
| 63% White |
| 12% Black |
| 16% Hispanic |
| 8% Asian/Other |
| 69% No degree |
| 31% 4 year degree |
Click on pdf file link below for full methodology and crosstabs by key demographic groups.


