West Long Branch, NJ – The race for Virginia governor is neck and neck in the first Monmouth University Poll of the 2017 election there. Pres. Trump could be having a small but decisive impact on the election as it stands now, driving some voters toward the Democratic nominee. The poll also finds that health care is the top issue for Virginia voters in this election.
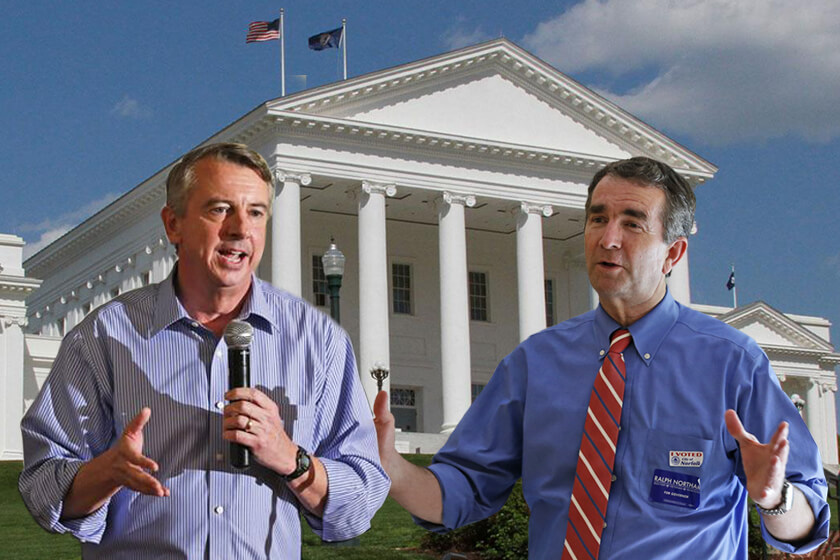
Currently, 44% of likely voters support Republican Ed Gillespie and 44% support Democrat Ralph Northam. Libertarian candidate Cliff Hyra gets 3% of the vote and 9% are undecided. Gillespie has 91% support among his fellow Republicans and Northam has 88% support among his fellow Democrats. Independents prefer the GOP nominee by a narrow 42% to 38% margin.
Donald Trump may not be the top issue for most Virginia voters, but he is having an impact on the 2017 election. Specifically, 4-in-10 voters say that Pres. Trump is either a major factor (26%) or minor factor (14%) in deciding how they will vote for governor. Those saying Trump is a factor include 52% of Northam supporters, 32% of Gillespie supporters, and 32% of those who are undecided or are supporting the third party candidate.
While Trump is a presence in this election, few voters would actually alter their intention at this point if he wasn’t a consideration. Nearly all Gillespie voters (99%) would stick with their choice if Trump was not a factor in their vote. Somewhat fewer Northam voters (88%) say they would stay with the Democrat, with many of the potential defectors (7%) moving into the undecided column. Taken together, these results suggest that Gillespie could actually have a lead of 45% to 40% over Northam – with 12% being undecided – if Trump did not currently figure into the equation.
“A small but crucial portion of Northam’s support is coming from voters who are primarily anti-Trump. Unless one of the candidates breaks out with a clear advantage on Virginia-centric issues, the president could wind up as a decisive factor in the outcome,” said Patrick Murray, director of the independent Monmouth University Polling Institute.
Murray added, “National pundits like to paint Virginia gubernatorial races as referenda on whichever president was just elected and they are almost always wrong. 2017 may turn out to be the first time you can credibly draw a direct link between the Oval Office and the race for governor.”
Currently, just 37% of likely voters in Virginia approve of the job Trump is doing as president while 57% disapprove. Among Gillespie voters, 78% approve of Trump and 18% disapprove. Among Northam voters, less than 1% approve of the president’s performance and 96% disapprove. Among those who are undecided or support the third party candidate, 22% approve and 60% disapprove of Trump.
The current governor, Democrat Terry McAuliffe, gets a much more positive rating from Virginia voters for his job performance – 52% approve and 37% disapprove. Among Gillespie voters, 24% approve and 66% disapprove. Among Northam voters, 83% approve of the governor and just 9% disapprove of the incumbent. Among those who are undecided or support the third party candidate, 42% approve and 34% disapprove of McAuliffe.
“If the election is a referendum on current office holders, Northam may have an easier time than Gillespie in picking up support from undecided voters,” said Murray.
Only 31% of Virginia voters say the country is heading in the right direction (with 62% saying it is on the wrong track), while a majority of 51% say the commonwealth is going in the right direction (with 38% saying it is on the wrong track). Undecided and third party voters are divided on Virginia’s trajectory – 39% right direction and 39% wrong track – but are decidedly negative about the country as a whole – 21% right direction and 61% wrong track.
Northam and Gillespie garner similar personal ratings. The Democrat earns a 38% favorable and 16% unfavorable rating, with 46% having no opinion of the current lieutenant governor. The Republican earns a 36% favorable and 20% unfavorable rating, with 44% having no opinion of the former RNC chair and White House counselor.
“The candidates still need to introduce themselves to voters and lay out their plans on key issues that Virginians want to hear them talk about. It’s worth noting, though, that only 3 percent of voters report having seen the campaign’s first debate on Saturday morning,” said Murray.
The poll asked likely voters to name the top issues they want the candidates for governor to address in this campaign. The most frequently mentioned issue is health care (37%), followed by jobs (25%), the economy (20%), and education (20%). Transportation and infrastructure (11%), taxes (10%), and illegal immigration (9%) are named by about 1-in-10 voters.
The Monmouth University Poll also found some interesting regional differences in current vote intentions. Northam has a 13 point lead over Gillespie in Northern Virginia (50% to 37%) and a 9 point lead in the eastern part of the commonwealth (50%-41%). The race is virtually tied in the central region (43% Gillespie and 41% Northam), while Gillespie has an 18 point advantage in the western half of Virginia (52% to 34% for Northam).
Four years ago, when McAuliffe won a narrow victory, the Democrat had a larger 22 point advantage over his Republican opponent in NoVa (58%-36%). Compared to the current poll, the Democrat had a similar 9 point margin in the east (51%-42%), but also had a 4 point edge in central Virginia (47%-43%). The 2013 Republican candidate, Ken Cuccinelli, won the western region by 21 points (57%-36%) that year, which is similar to Gillespie’s current advantage there. When Gillespie himself lost an even narrower race for U.S. Senate the following year, his Democratic opponent Mark Warner claimed a 17 point advantage in NoVa and a 12 point win in the east (55%-43%). Gillespie actually beat Warner by 6 points in central Virginia (52%-46%) and by 19 points in the west (58%-39%).
“Compared to his 2014 performance, Gillespie is currently holding similar leads in both central and western Virginia. Northam’s lead in northern Virginia, on the other hand, lags the current incumbent’s margin there from 2013. These dynamics are serving to keep the 2017 race neck and neck right now,” said Murray.
Other demographic differences in gubernatorial vote intent include:
- Women: 50% Northam, 37% Gillespie; Men: 51% Gillespie, 37% Northam.
- White non-Hispanic voters: 52% Gillespie, 36% Northam; Other race/Hispanic: 69% Northam, 18% Gillespie.
- Age 18-49: 50% Northam, 39% Gillespie; Age 50-64: 46% Gillespie, 38% Northam: Age 65+: 47% Gillespie, 43% Northam.
- College graduate: 47% Northam, 42% Gillespie; No degree: 47% Gillespie, 38% Northam.
The Monmouth University Poll was conducted by telephone from July 20 to 23, 2017 with 502 Virginia residents likely to vote in the 2017 gubernatorial election. The results in this release have a margin of error of +/- 4.4 percent. The poll was conducted by the Monmouth University Polling Institute in West Long Branch, NJ.
QUESTIONS AND RESULTS
(* Some columns may not add to 100% due to rounding.)
1/2. If the election for governor was today, would you vote for Ed Gillespie the Republican, Ralph Northam the Democrat, or Cliff Hyra the Libertarian? [IF UNDECIDED: If you had to vote for one of the following at this moment, do you lean more toward Ed Gillespie or Ralph Northam?] [NAMES WERE ROTATED]
| Likely voters with leaners | July 2017 |
| Ed Gillespie | 44% |
| Ralph Northam | 44% |
| Cliff Hyra | 3% |
| (VOL) Other, write-in | <1% |
| (VOL) Undecided | 9% |
| (n) | (502) |
[QUESTIONS 3 & 4 WERE ROTATED]
3. Is your general impression of Ed Gillespie favorable or unfavorable, or do you have no opinion of him?
| July 2017 | |
| Favorable | 36% |
| Unfavorable | 20% |
| No opinion | 44% |
| (n) | (502) |
4. Is your general impression of Ralph Northam favorable or unfavorable, or do you have no opinion of him?
| July 2017 | |
| Favorable | 38% |
| Unfavorable | 16% |
| No opinion | 46% |
| (n) | (502) |
[QUESTIONS 5 & 6 WERE ROTATED]
5. Do you approve or disapprove of the job Donald Trump is doing as president?
| July 2017 | |
| Approve | 37% |
| Disapprove | 57% |
| (VOL) Don’t know | 6% |
| (n) | (502) |
6. Do you approve or disapprove of the job Terry McAuliffe doing as governor?
| July 2017 | |
| Approve | 52% |
| Disapprove | 37% |
| (VOL) Don’t know | 11% |
| (n) | (502) |
[QUESTIONS 7 & 8 WERE ROTATED]
7. Would you say things in the country are going in the right direction, or have they gotten off on the wrong track?
| July 2017 | |
| Right direction | 31% |
| Wrong track | 62% |
| (VOL) Depends | 4% |
| (VOL) Don’t know | 3% |
| (n) | (502) |
8. Would you say things in Virginia are going in the right direction, or have they gotten off on the wrong track?
| July 2017 | |
| Right direction | 51% |
| Wrong track | 38% |
| (VOL) Depends | 7% |
| (VOL) Don’t know | 4% |
| (n) | (502) |
9. In your opinion, what are the most important one or two issues that the candidates for governor should talk about during this campaign? [LIST WAS NOT READ] [Note: Results add to more than 100% because multiple responses were accepted.]
| July 2017 | |
| Taxes | 10% |
| Jobs | 25% |
| The economy | 20% |
| Cost of living | 1% |
| Housing availability, costs | 1% |
| State budget, govt spending | 7% |
| Govt ethics, corruption | 3% |
| Education, public schools | 20% |
| Higher educ, universities | 3% |
| Transportation, infrastructure | 11% |
| Environment | 5% |
| Health care, insurance | 37% |
| Military, veterans issues | 2% |
| Crime, violence | 3% |
| Gun control, 2nd Amendment | 3% |
| Illegal immigration | 9% |
| Opioid/addiction crisis | 1% |
| Senior issues | 1% |
| Race issues | 1% |
| Traditional values, equal rights | 4% |
| Voting access, fraud | 1% |
| Other | 6% |
| Don’t know/no answer | 9% |
| (n) | (502) |
10. Is Donald Trump a major factor, minor factor, or not a factor in deciding how you will vote for governor?
| July 2017 | |
| Major factor | 26% |
| Minor factor | 14% |
| Not a factor | 59% |
| (VOL) Don’t know | 1% |
| (n) | (502) |
11. If Trump was not a factor in your vote choice, who would you support for governor – Ed Gillespie or Ralph Northam? [The following table represents the recalculated vote intent of all likely voters taking into account any potential Trump impact. This includes the revised choices of those who would change their vote if Trump was not a factor plus the original vote choice of those who do not change their intent regardless of whether Trump is a factor in their vote.]
| July 2017 | |
| Ed Gillespie | 45% |
| Ralph Northam | 40% |
| (VOL) Cliff Hyra | 2% |
| (VOL) Other/neither | 1% |
| (VOL) Don’t know | 12% |
| (n) | (502) |
[The following question was asked on Saturday/Sunday only; n=231, m.o.e. +/-6.5.]
12. Did you watch Saturday morning’s debate between Gillespie and Northam, or did you not have an opportunity to watch this?
| July 2017 | |
| Watched | 3% |
| Did not watch | 97% |
| (n) | (231) |
METHODOLOGY
The Monmouth University Poll was sponsored and conducted by the Monmouth University Polling Institute from July 20 to 23, 2017 with a statewide random sample of 502 likely Virginia voters drawn from a list of registered voters who voted in at least two of the last four general elections or have registered to vote since January 2016, and indicate they are likely to vote in the upcoming election. This includes 277 contacted by a live interviewer on a landline telephone and 225 contacted by a live interviewer on a cell phone. Monmouth is responsible for all aspects of the survey design, data weighting and analysis. Final sample is weighted for party primary voting history, age, gender, and race based on state voter registration list and U.S. Census information. Data collection support provided by Braun Research (field) and Aristotle (voter sample). For results based on this sample, one can say with 95% confidence that the error attributable to sampling has a maximum margin of plus or minus 4.4 percentage points (unadjusted for sample design). Sampling error can be larger for sub-groups (see table below). In addition to sampling error, one should bear in mind that question wording and practical difficulties in conducting surveys can introduce error or bias into the findings of opinion polls.
VA Regions:
NoVa – Loudon, Fairfax, Arlington, and Prince William counties and included cities.
East – counties and cities along the Chesapeake Bay and tributary rivers (James, York, Rappahannock), including Virginia Beach, Newport News and Norfolk.
Central – Counties and cities that straddle either side of I-95, including Richmond.
West –the area west of a north-south line from Clarke/Fauquier to Mecklenburg counties.
| DEMOGRAPHICS (weighted) |
| Primary Voting History |
| 47% Republican |
| 36% Democrat |
| 18% Independent |
| Self-Reported Party ID |
| 27% Republican |
| 43% Independent |
| 30% Democrat |
| 46% Male |
| 54% Female |
| 10% 18-34 |
| 23% 35-49 |
| 36% 50-64 |
| 31% 65+ |
| 73% White |
| 18% Black |
| 4% Hispanic |
| 4% Asian/Other |
Click on pdf file link below for full methodology and results by key demographic groups.