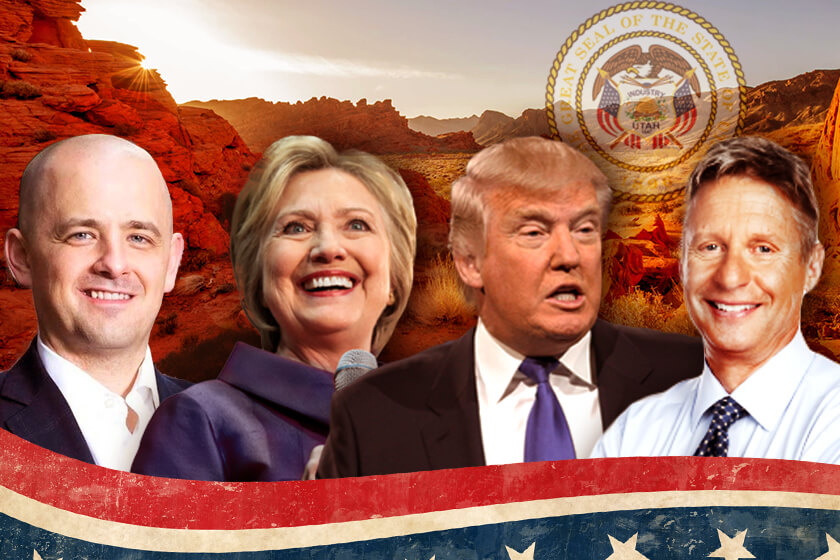
West Long Branch, NJ – Donald Trump remains ahead in the race for Utah’s electoral votes – matching the 6 point lead he had in last month’s Monmouth University Poll . While independent candidate Evan McMullin continues to claim a significant share of support from Republican voters, he still trails in third place behind Hillary Clinton. Most Beehive State voters believe Clinton is going to win the presidency, but very few would change their vote if they thought the race was closer.
Among Utah voters who have already cast their ballots or are likely to vote in next week’s presidential election, 37% currently support Trump, 31% back Clinton, and 24% back McMullin. Another 4% support Libertarian Gary Johnson and 1% back Green Party candidate Jill Stein. The race has changed little since early October, when voter support stood at 34% for Trump, 28% for Clinton, and 20% for McMullin.
“It’s been nearly 50 years since a third party candidate won any state’s electoral votes. That streak should remain intact. While McMullin has cut into Trump’s partisan support, the independent candidate has not broken out of third place,” said Patrick Murray, director of the non-partisan Monmouth University Polling Institute.
Self-identified Republicans support Trump over McMullin by a 56% to 34% margin, with 4% supporting Clinton. Among independent voters, 34% support Trump, 32% back Clinton, and 24% support McMullin. Nearly all self-identified Democrats (86%) are voting for Clinton. McMullin gets more support from voters under 50 years old – 30% compared with 33% for Trump and 26% for Clinton – than he does with those age 50 and older – 18% compared with 40% for Trump and 37% for Clinton.
McMullin’s primary appeal has been to values-minded Mormon voters who make up 60% of Utah’s electorate. The independent candidate (37%) barely trails Trump (43%) among Mormon voters, with Clinton garnering 14% of this group’s vote. In October, Trump led McMullin by a similar margin of 38% to 32%, with Clinton at 13%. Clinton has a sizable lead among the 4-in-10 voters with another religious affiliation or no religious identity at all, earning 54% of this group’s vote compared with 29% for Trump and just 7% for McMullin. This dynamic is basically unchanged from the October poll’s result of 50% for Clinton, 29% for Trump, and 4% for McMullin among non-Mormon voters.
The Monmouth University Poll finds that Utah voters have an overwhelmingly negative opinion of both major party nominees – 22% favorable to 67% unfavorable for Trump and 23% favorable to 66% unfavorable for Clinton. Both candidates’ ratings have barely budged in the past month. Independent candidate McMullin does better than the other candidates with a net positive 36% favorable and 16% unfavorable rating. However, nearly half (49%) of Utah voters feel they still don’t know enough about him to give a rating.
More than one-third of likely Utah voters in this election have already cast their ballots. Clinton holds a lead of 43% to 33% over Trump among these early voters, with McMullin at 16%. Among those who have not yet voted, 39% intend to vote for Trump, 29% intend to vote for McMullin, and 24% intend to vote for Clinton.
Despite what may happen with Utah’s electoral votes, most Beehive State voters (57%) believe that Clinton will probably be elected president. Only 25% think Trump will emerge victorious. Even if they thought Clinton and Trump were running neck and neck, though, only 11% say they would be likely to change who they are voting for, including about 3-in-10 McMullin supporters (29%). These movable voters would split almost evenly between Trump and Clinton, however, and would not have any significant impact on the state of the race in Utah. As a further sign of stability in the vote here, only 3% say they changed their mind about who they would vote for after the FBI email investigation news broke on Friday.
The presidential race aside, Republicans continue to enjoy a typically large advantage in other statewide contests. In the election for U.S. Senate, first-term incumbent Mike Lee has a 61% to 28% lead over challenger Misty Snow. In the race for governor, incumbent Gary Herbert has a 63% to 30% lead over challenger Mike Weinholtz. These results are basically unchanged from last month’s poll, with more than 8-in-10 Trump voters and McMullin voters alike giving their support to down-ballot Republicans, while more than 7-in-10 Clinton voters back the Democratic candidates for U.S. Senate and governor.
The Monmouth University Poll was conducted by telephone from October 30 to November 2, 2016 with 402 Utah residents likely to vote in the November election. This sample has a margin of error of ± 4.9 percent. The poll was conducted by the Monmouth University Polling Institute in West Long Branch, NJ.
QUESTIONS AND RESULTS
(* Some columns may not add to 100% due to rounding.)
1/2. If the election for President was today, would you vote for Donald Trump the Republican, Hillary Clinton the Democrat, Gary Johnson the Libertarian, Jill Stein of the Green Party, or independent candidate Evan McMullin? [IF UNDECIDED: If you had to vote for one of the following candidates at this moment, who do you lean toward – Donald Trump, Hillary Clinton, or Evan McMullin?] [NAMES WERE ROTATED]
| (with leaners) | Nov. 2016 | Oct. 2016* |
| Donald Trump | 37% | 34% |
| Hillary Clinton | 31% | 28% |
| Gary Johnson | 4% | 9% |
| Jill Stein | 1% | 1% |
| Evan McMullin | 24% | 20% |
| (VOL) Other candidate | 1% | 1% |
| (VOL) Undecided | 2% | 6% |
| (n) | (402) | (403) |
[NOTE: Evan McMullin was not included in the leaner question for October 2016.]
3. If the election for U.S. Senate was today, would you vote for Mike Lee the Republican, Misty Snow the Democrat, or some other candidate? [IF UNDECIDED: If you had to vote for one of the following candidates at this moment, who do you lean toward – Mike Lee or Misty Snow?] [NAMES WERE ROTATED]
| (with leaners) | Nov. 2016 | Oct. 2016 |
| Mike Lee | 61% | 60% |
| Misty Snow | 28% | 31% |
| Other candidate | 5% | 3% |
| (VOL) Undecided | 5% | 6% |
| (n) | (402) | (403) |
4. If the election for governor was today, would you vote for Gary Herbert the Republican, Mike Weinholtz the Democrat, or some other candidate? [IF UNDECIDED: If you had to vote for one of the following candidates at this moment, who do you lean toward – Gary Herbert or Mike Weinholtz?] [NAMES WERE ROTATED]
| (with leaners) | Nov. 2016 | Oct.
2016 |
| Gary Herbert | 63% | 63% |
| Mike Weinholtz | 30% | 30% |
| Other candidate | 5% | 2% |
| (VOL) Undecided | 2% | 5% |
| (n) | (402) | (403) |
Regardless of who you may support…
[QUESTIONS 5 THROUGH 7 WERE ROTATED]
5. Is your general impression of Donald Trump favorable or unfavorable, or do you have no opinion of him?
| Nov. 2016 | Oct. 2016 | |
| Favorable | 22% | 19% |
| Unfavorable | 67% | 71% |
| No opinion | 11% | 10% |
| (n) | (402) | (403) |
6. Is your general impression of Hillary Clinton favorable or unfavorable, or do you have no opinion of her?
| Nov. 2016 | Oct. 2016 | |
| Favorable | 23% | 25% |
| Unfavorable | 66% | 69% |
| No opinion | 11% | 6% |
| (n) | (402) | (403) |
7. Is your general impression of Evan McMullin favorable or unfavorable, or do you have no opinion of him?
| Nov. 2016 | Oct. 2016 | |
| Favorable | 36% | 28% |
| Unfavorable | 16% | 6% |
| No opinion | 49% | 66% |
| (n) | (402) | (403) |
8. Who do you think will probably win the national election for president, Donald Trump or Hillary Clinton?
| Nov. 2016 | |
| Trump | 25% |
| Clinton | 57% |
| (VOL) Neither/someone else | 3% |
| (VOL) Don’t know | 15% |
| (n) | (402) |
9. How likely would you be to change your vote if you thought Trump and Clinton were running neck and neck in the presidential race nationally – very likely, somewhat likely, or not likely?
| Nov. 2016 | |
| Very likely | 5% |
| Somewhat likely | 6% |
| Not likely | 87% |
| (VOL) Don’t know | 2% |
| (n) | (402) |
10. Who would you vote for in that scenario? [RECALCULATED VOTE including changed votes plus original candidate choice of voters who say they would not change their minds if the race had been tighter.]
| Nov. 2016 | |
| Donald Trump | 41% |
| Hillary Clinton | 33% |
| Gary Johnson | 3% |
| Jill Stein | 1% |
| Evan McMullin | 19% |
| Other candidate | 1% |
| Not sure | 3% |
| (n) | (402) |
11. Have you read or heard about Friday’s news that the FBI is now looking into newly discovered emails from Hillary Clinton’s time as Secretary of State, or have you not heard about this recent news?
| Nov. 2016 | |
| Yes, heard | 97% |
| Not heard | 3% |
| (n) | (402) |
12. Has this recent news changed your mind about who you will vote for in the presidential election, or has it not really changed your vote choice?
| Nov. 2016 | |
| Changed mind about vote | 3% |
| Not really changed vote choice | 93% |
| (VOL) Don’t know | 1% |
| Not heard | 3% |
| (n) | (402) |
METHODOLOGY
The Monmouth University Poll was sponsored and conducted by the Monmouth University Polling Institute from October 30 to November 2, 2016 with a random sample of 402 likely Utah voters. Interviews were conducted by a live caller in English, including 351 drawn from a list of registered voters (201 landline / 150 cell phone) and a random digit dial supplement of 51 cell phone interviews. Monmouth is responsible for all aspects of the survey design, data weighting and analysis. The final sample is weighted for age, gender, race and partisanship based on voter list and U.S. Census information. Data collection support provided by Braun Research (field), Aristotle (voter list sample), and SSI (RDD sample). For results based on this sample, one can say with 95% confidence that the error attributable to sampling has a maximum margin of plus or minus 4.9 percentage points (unadjusted for sample design). Sampling error can be larger for sub-groups (see table below). In addition to sampling error, one should bear in mind that question wording and practical difficulties in conducting surveys can introduce error or bias into the findings of opinion polls.
| DEMOGRAPHICS (weighted) |
| Self-Reported |
| 39% Republican |
| 43% Independent |
| 18% Democrat |
| 49% Male |
| 51% Female |
| 24% 18-34 |
| 30% 35-49 |
| 26% 50-64 |
| 20% 65+ |
| 95% White |
| 1% Black |
| 2% Hispanic |
| 2% Other |
Click on pdf file link below for full methodology and results by key demographic groups.