
West Long Branch, NJ – The U.S. Supreme Court begins its new session on Monday with a majority of Americans saying it is out of touch with the country. The Monmouth (“Mon-muth”) University Poll finds that decidedly negative views of the court which formed after news leaked about the Dobbs abortion decision continue to hold. The poll also finds widespread support for setting term limits for justices, but few Americans back expanding the size of the court.
About 6 in 10 Americans (59%) say the current Supreme Court is out of touch with the values and beliefs of most Americans. Just one-third (34%) say the court is in touch with the public. Most Democrats (83%) and independents (62%) feel the court is out of touch, while just 32% of Republicans agree. More women (64%) than men (55%) and more people of color (65%) than white non-Hispanic Americans (56%) say the court is out of touch. Also, Americans under 35 years old (70%) are more likely than those aged 35 and older (55%) to feel this way.
“The Supreme Court was not on the radar for many Americans until this summer. Recent decisions have moved some from being on the fence to having a negative opinion of the court,” said Patrick Murray, director of the independent Monmouth University Polling Institute.
Currently, 54% of the American public disapproves of the job the Supreme Court is doing, compared with 37% who approve. Disapproval moved into majority territory after news leaked in May of the impending abortion decision. Public opinion of the court was evenly divided in Monmouth’s March poll (42% approve and 42% disapprove). Also, 16% of the public had no opinion of the court in March, but that number dipped to 5% in August and stands at 9% today.
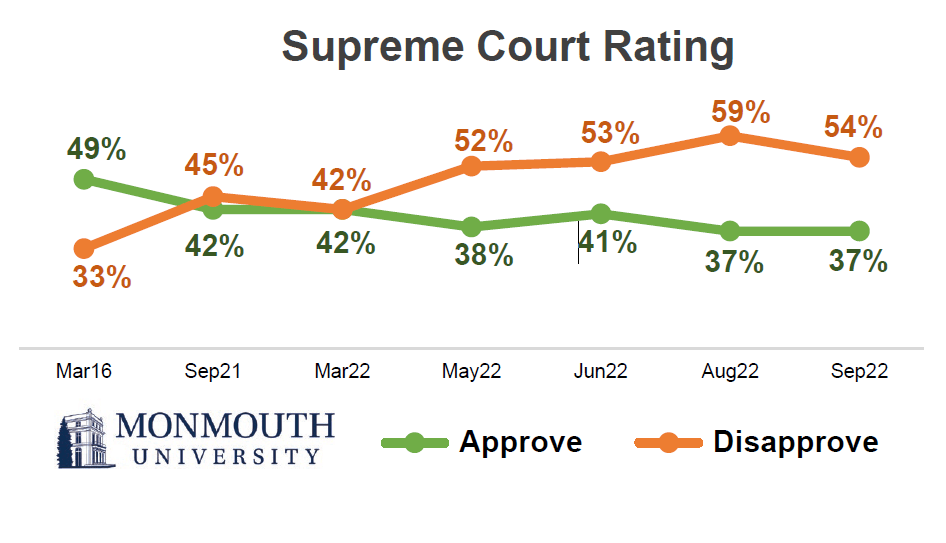
The Supreme Court held a net positive rating in 2016 (49% approve and 33% disapprove), which flipped to a negative rating in 2021 (42%–45%) after ideological control of the court shifted to the right. In 2016, Democrats (65%) were more likely than Republicans (36%) to approve of the job the court was doing. That flipped five years later, with more Republicans (52%) than Democrats (31%) giving the court positive marks. However, the sharp climb in negative views of the court that occurred in the past few months is especially notable. Disapproval of the court among Democrats went from 54% in March of this year to 81% now and among independents it went from 37% to 54%. Among Republicans, on the other hand, disapproval of the court has actually declined from 36% in March to 28% now. Negative views of the Supreme Court increased by 15 points among women since March (from 44% to 59%) and by 9 points among men (from 39% to 48%) as well as by 17 points among the white non-Hispanic population (from 38% to 55%) and by 7 points among Black, Hispanic and other racial groups (from 48% to 55%).
The Monmouth University Poll also finds two-thirds (66%) of the public would support creating term limits for Supreme Court justices. This includes clear majorities of Democrats (86%) and independents (63%) and just over half of Republicans (51%). However, just 36% of the public backs expanding the size of the court beyond its current nine justices. While Democrats (67%) show majority support for this proposal, they are joined by few independents (30%) and Republicans (14%).
“As it stands, most Americans are uncomfortable with lifetime appointments to the court, but this is not something they are really thinking about. If a term limit proposal actually entered the public debate, I expect Republican opinion would move against it based on the impact it could have on the court’s current ideological leaning,” said Murray.
When the Supreme Court meets for its new term on Monday, it will include the first African-American woman to serve on the nation’s highest bench. Most Americans say it is either very (37%) or somewhat (24%) important for the Supreme Court to look like the racial, ethnic, and gender composition of the country as a whole. Another 12% say this is not too important and 26% say it is not at all important. The number of Americans who say representation on the court is very important has declined by 9 points since March after Ketanji Brown Jackson’s nomination was announced. Interestingly this decline has come mainly among Democrats (from 80% in March to 62% now).
The Monmouth University Poll was conducted by telephone from September 21 to 25, 2022 with 806 adults in the United States. The question results in this release have a margin of error of +/- 3.5 percentage points. The poll was conducted by the Monmouth University Polling Institute in West Long Branch, NJ.
QUESTIONS AND RESULTS
(* Some columns may not add to 100% due to rounding.)
[Q1-10 held for future release.]
11.Do you approve or disapprove of the job the U.S. Supreme Court is doing?
| TREND: | Sept. 2022 | Aug. 2022 | June 2022 | May 2022 | March 2022 | Sept. 2021 | March 2016 |
| Approve | 37% | 37% | 41% | 38% | 42% | 42% | 49% |
| Disapprove | 54% | 59% | 53% | 52% | 42% | 45% | 33% |
| (VOL) Don’t know | 9% | 5% | 7% | 10% | 16% | 12% | 17% |
| (n) | (806) | (808) | (747) | (807) | (809) | (802) | (1,008) |
[Q12-21 previously released.]
22.Is the current Supreme Court in touch or out of touch with the values and beliefs of most Americans?
| Sept. 2022 | |
| In touch | 34% |
| Out of touch | 59% |
| (VOL) Don’t know | 7% |
| (n) | (806) |
23.How important is it for the Supreme Court to look like the racial, ethnic and gender composition of the country as a whole – very important, somewhat important, not too important, or not at all important?
| TREND: | Sept. 2022 | March 2022 |
| Very important | 37% | 46% |
| Somewhat important | 24% | 23% |
| Not too important | 12% | 10% |
| Not at all important | 26% | 20% |
| (VOL) Don’t know | 1% | 1% |
| (n) | (806) | (809) |
[QUESTIONS 24 & 25 WERE ROTATED]
24.The Supreme Court currently has nine justices. Would you support or oppose expanding the size of the Supreme Court?
| TREND: | Sept. 2022 | June 2022 | Sept. 2021 |
| Support | 36% | 38% | 36% |
| Oppose | 60% | 56% | 58% |
| (VOL) Don’t know | 4% | 6% | 6% |
| (n) | (806) | (747) | (802) |
25.The Supreme Court is currently a lifetime appointment. Would you support or oppose creating term limits for Supreme Court justices?
| Sept. 2022 | |
| Support | 66% |
| Oppose | 31% |
| (VOL) Don’t know | 3% |
| (n) | (806) |
[Q26-32 held for future release.]
METHODOLOGY
The Monmouth University Poll was sponsored and conducted by the Monmouth University Polling Institute from September 21 to 25, 2022 with a probability-based national random sample of 806 adults age 18 and older. This includes 283 contacted by a live interviewer on a landline telephone and 523 contacted by a live interviewer on a cell phone, in English. Telephone numbers were selected through a mix of random digit dialing and list-based sampling. Landline respondents were selected with a modified Troldahl-Carter youngest adult household screen. Interviewing services were provided by Braun Research, with sample obtained from Dynata (RDD, n=571), Aristotle (list, n=156) and a panel of prior Monmouth poll participants (n=79). Monmouth is responsible for all aspects of the survey design, data weighting and analysis. The full sample is weighted for region, age, education, gender and race based on US Census information (ACS 2018 one-year survey). For results based on this sample, one can say with 95% confidence that the error attributable to sampling has a maximum margin of plus or minus 3.5 percentage points (unadjusted for sample design). Sampling error can be larger for sub-groups (see table below). In addition to sampling error, one should bear in mind that question wording and practical difficulties in conducting surveys can introduce error or bias into the findings of opinion polls.
DEMOGRAPHICS (weighted) |
| Self-Reported |
| 28% Republican |
| 43% Independent |
| 29% Democrat |
| 49% Male |
| 51% Female |
| 30% 18-34 |
| 33% 35-54 |
| 37% 55+ |
| 63% White |
| 12% Black |
| 16% Hispanic |
| 8% Asian/Other |
| 69% No degree |
| 31% 4 year degree |
Click on pdf file link below for full methodology and crosstabs by key demographic groups.


