
West Long Branch, NJ – The number of Americans who are financially struggling has increased by double digits in the past year as inflation and gas prices top the list of problems faced by the nation’s families. The Monmouth (“Mon-muth”) University Poll finds a majority say the federal government’s actions are hurting them and that President Joe Biden’s policies are not benefitting the middle class. Preference for party control of Congress remains divided, with no real movement since the spring.
More than 4 in 10 Americans (42%) say they are struggling to remain where they are financially. This is the first time since Monmouth started asking the question five years ago that the number topped 3 in 10 – the range in prior polls was 20% to 29%. Just under half (47%) say their current financial situation is basically stable and only 9% say it is improving. The high point for improving was 25% in April 2019. The number of people who say they are struggling has increased by 18 points since last year (from 24% to 42%), with that increase being fairly across the board when examining key demographic groups, including income, race, and partisanship (* see note). Currently, reports of struggling financially come from 58% of those earning under $50,000 (up 18 points from June 2021), 35% of those earning $50,000-$100,000 (up 15 points), and 28% of those earning over $100,000 (up 18 points).
Nearly half of the public names either inflation (33%) or gas prices (15%) as the biggest concern facing their family right now. The economy in general (9%) and paying everyday bills (6%) are among other financial concerns mentioned. Abortion, which has registered less than 1% on this question in prior Monmouth polls going back to 2015, is currently named by 5% – predominantly among Democrats (9%). Inflation and gas prices are the top two family concerns across a wide variety of demographic groups, including income, race, and partisan identity. Inflation as a top concern emerged in Monmouth’s July 2021 poll at 5% and then grew to 14% in December, before more than doubling in the current poll. The current poll is also the first time that gas prices are mentioned by more than a handful of Americans as their predominant issue. One year ago, the poll registered a wider variety of top issues, including the pandemic (17%), the economy (11%), everyday bills (11%), health care costs (7%) and job security (7%).
“Economic concerns tend to rise to the top of the list of family concerns, as you might expect, but the singular impact of inflation is really hitting home right now. And most Americans are blaming Washington for their current pain,” said Patrick Murray, director of the independent Monmouth University Polling Institute.
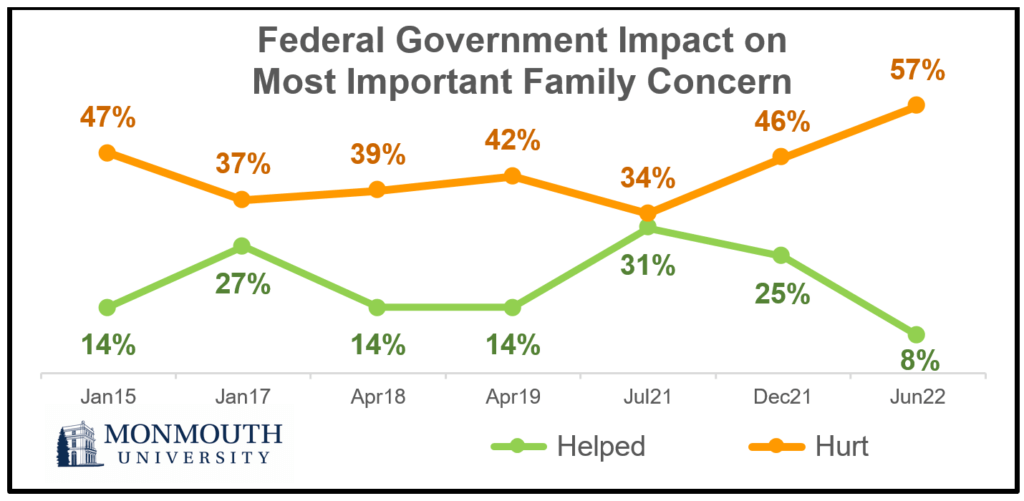
A majority of 57% say that the actions of the federal government over the past six months have hurt their family when it comes to their most important concern. Just 8% say Washington has helped them and 34% say federal actions have had no real impact on their top concern. In prior polls, between 34% and 47% said government actions have hurt them on their biggest family concern. The current poll marks the first time this sentiment is in the majority. The results also indicate little optimism about the future – just 23% expect that future government actions over the next few years will help improve their family’s top concern while 45% say Washington will hurt them. One year ago, that response was basically flipped (40% expected to be helped and 34% expected to be hurt).
Currently, 54% of Americans say the middle class has not benefited at all from Biden’s policies. This is up from 36% one year ago and it is also higher than 36% who said the same about former President Donald Trump at about the same point in his term (April 2018). It is even higher than 46% who said the same about former President Barack Obama in 2013, when Monmouth first posed this question. Just 7% say the middle class has been helped a lot by Biden’s policies and 34% say they have been helped a little. A majority (52%) also say that poor families have not benefited from Biden’s presidency, up from 29% in July 2021. The current result was similar for Trump in 2018 (53%) but it is higher than it was for Obama in 2013 (37%).
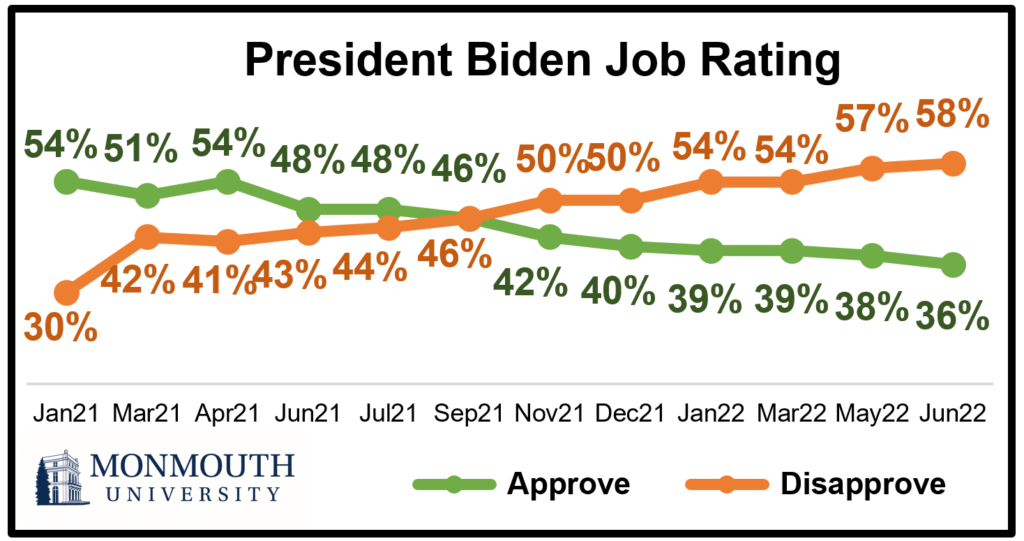
Biden’s overall job rating continues to trend downward. Currently, just 36% approve of the job he is doing while 58% disapprove. It has now been a year since Biden held a net positive rating (48% approve and 44% disapprove in July 2021). Just 10% of Americans say the country is headed in the right direction while 88% say it is on the wrong track. This marks an all-time low for this question going back to 2013. The prior low was recorded in May of this year at 18% right direction and 79% wrong track. Just 15% approve of the job Congress is doing, matching the May result.
“The state of the economy has Americans in a foul mood. They are not happy with Washington. However, that has not changed the overall picture of whom they want in control of Congress. The question is who actually shows up to vote in the fall,” said Murray.
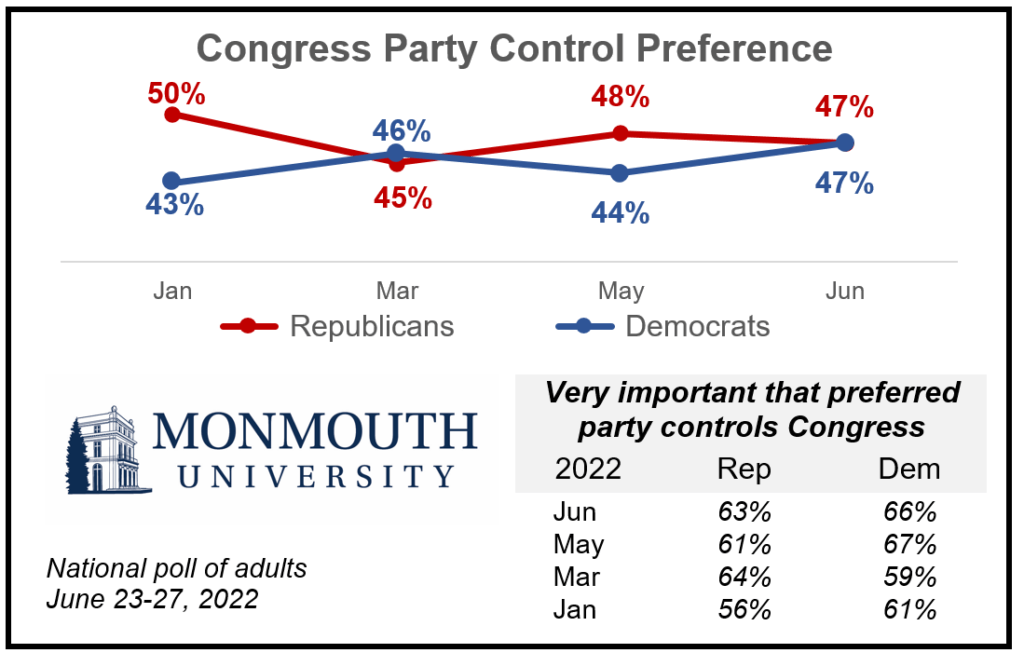
The public remains divided on whether they prefer to have the Republicans (36%) or the Democrats (38%) in control of Congress. When the poll pushed for “leaners” among those who initially say party control does not matter, 11% gets added to the GOP column and 9% for the Democrats. The combined 47% Republican and 47% Democrat split represents a statistically insignificant shift from the parties’ relative standing in prior polls. Six in 10 (60%) Americans say it is very important to have their preferred party in control of Congress. This congressional control importance metric is similar among those who want Democrats (66%) and those who want Republicans (63%) leading Congress.
The Monmouth University Poll was conducted by telephone from June 23 to 27, 2022 with 978 adults in the United States. The question results in this release have a margin of error of +/- 3.1 percentage points. The poll was conducted by the Monmouth University Polling Institute in West Long Branch, NJ.
QUESTIONS AND RESULTS
(* Some columns may not add to 100% due to rounding.)
1.Do you approve or disapprove of the job Joe Biden is doing as president?
| TREND: | June 2022 | May 2022 | March 2022 | Jan. 2022 | Dec. 2021 | Nov. 2021 | Sept. 2021 | July 2021 | June 2021 | April 2021 | March 2021 | Jan. 2021 |
| Approve | 36% | 38% | 39% | 39% | 40% | 42% | 46% | 48% | 48% | 54% | 51% | 54% |
| Disapprove | 58% | 57% | 54% | 54% | 50% | 50% | 46% | 44% | 43% | 41% | 42% | 30% |
| (VOL) No opinion | 6% | 5% | 7% | 7% | 11% | 9% | 8% | 8% | 9% | 5% | 8% | 16% |
| (n) | (978) | (807) | (809) | (794) | (808) | (811) | (802) | (804) | (810) | (800) | (802) | (809) |
2.Do you approve or disapprove of the job the U.S. Congress is doing?
| TREND: | June 2022 | May 2022 | March 2022 | Jan. 2022 | Dec. 2021 | Nov. 2021 | Sept. 2021 | July 2021 | June 2021 | April 2021 | March 2021 | Jan. 2021 |
| Approve | 15% | 15% | 21% | 19% | 23% | 18% | 22% | 23% | 21% | 35% | 30% | 35% |
| Disapprove | 78% | 77% | 71% | 74% | 66% | 70% | 65% | 62% | 65% | 56% | 59% | 51% |
| (VOL) No opinion | 7% | 8% | 8% | 6% | 11% | 12% | 13% | 15% | 15% | 9% | 11% | 14% |
| (n) | (978) | (807) | (809) | (794) | (808) | (811) | (802) | (804) | (810) | (800) | (802) | (809) |
| TREND: Continued | Nov. 2020 | Early June 2020 | May 2020 | April 2020 | Feb. 2020 | Jan. 2020 | Dec. 2019 | Nov. 2019 | Sept. 2019 | Aug. 2019 | June 2019 | May 2019 | April 2019 | March 2019 | Jan. 2019 |
| Approve | 23% | 22% | 32% | 32% | 20% | 24% | 22% | 23% | 21% | 17% | 19% | 20% | 24% | 23% | 18% |
| Disapprove | 64% | 69% | 55% | 55% | 69% | 62% | 65% | 64% | 68% | 71% | 69% | 71% | 62% | 68% | 72% |
| (VOL) No opinion | 13% | 9% | 13% | 13% | 11% | 14% | 13% | 13% | 11% | 13% | 12% | 9% | 14% | 9% | 10% |
| (n) | (810) | (807) | (808) | (857) | (902) | (903) | (903) | (908) | (1,161) | (800) | (751) | (802) | (801) | (802) | (805) |
| TREND: Continued | Nov. 2018 | Aug. 2018 | June 2018 | April 2018 | March 2018 | Jan. 2018 | Dec. 2017 | Sept. 2017 | Aug. 2017 | July 2017 | May 2017 | March 2017 | Jan. 2017 |
| Approve | 23% | 17% | 19% | 17% | 18% | 21% | 16% | 17% | 18% | 19% | 19% | 25% | 23% |
| Disapprove | 63% | 69% | 67% | 71% | 72% | 68% | 65% | 69% | 69% | 70% | 68% | 59% | 66% |
| (VOL) No opinion | 14% | 14% | 14% | 12% | 11% | 11% | 19% | 15% | 13% | 11% | 13% | 16% | 11% |
| (n) | (802) | (805) | (806) | (803) | (803) | (806) | (806) | (1,009) | (805) | (800) | (1,002) | (801) | (801) |
| TREND: Continued | Sept. 2016* | Aug. 2016* | June 2016* | March 2016 | Jan. 2016 | Dec. 2015 | Oct. 2015 | Sept. 2015 | Aug. 2015 | July 2015 | June 2015 | April 2015 | Jan. 2015 | Dec. 2014 | July 2013 |
| Approve | 15% | 14% | 17% | 22% | 17% | 16% | 17% | 19% | 18% | 18% | 19% | 21% | 18% | 17% | 14% |
| Disapprove | 77% | 78% | 76% | 68% | 73% | 73% | 71% | 71% | 72% | 69% | 71% | 67% | 70% | 73% | 76% |
| (VOL) No opinion | 8% | 9% | 7% | 10% | 10% | 10% | 12% | 11% | 11% | 12% | 10% | 12% | 11% | 11% | 10% |
| (n) | (802) | (803) | (803) | (1,008) | (1,003) | (1,006) | (1,012) | (1,009) | (1,203) | (1,001) | (1,002) | (1,005) | (1,003) | (1,008) | (1,012) |
* Registered voters
3.Would you rather see the Republicans or the Democrats in control of Congress, or doesn’t this matter to you? [CHOICES WERE ROTATED] [If DOES NOT MATTER: If you had to lean one way or the other would you pick the Republicans or the Democrats?]
| TREND: | June 2022 | May 2022 | March 2022 | Jan. 2022 |
| Republicans | 36% | 36% | 33% | 35% |
| Not matter, but lean Rep | 11% | 12% | 12% | 15% |
| Democrats | 38% | 34% | 33% | 33% |
| Not matter, but lean Dem | 9% | 10% | 13% | 10% |
| Does not matter, no lean | 6% | 7% | 9% | 7% |
| (VOL) Don’t know | 1% | 1% | 1% | 0% |
| (n) | (978) | (807) | (809) | (794) |
4.Is it very important, somewhat important, or only a little important to have [Republicans/Democrats] in control of Congress? [CHOICE READ FROM Q3]
| TREND: | June 2022 | May 2022 | March 2022 | Jan. 2022 |
| Very important | 60% | 59% | 56% | 54% |
| Somewhat important | 20% | 20% | 21% | 23% |
| Only a little important | 11% | 12% | 12% | 15% |
| (VOL) Don’t know / Does not matter who controls Congress (from Q3) | 9% | 9% | 11% | 8% |
| (n) | (978) | (807) | (809) | (794) |
[Q5 previously released.]
6.Would you say things in the country are going in the right direction, or have they gotten off on the wrong track?
| TREND: | June 2022 | May 2022 | March 2022 | Jan. 2022 | Dec. 2021 | Nov. 2021 | Sept. 2021 | July 2021 | June 2021 | April 2021 | March 2021 | Jan. 2021 |
| Right direction | 10% | 18% | 24% | 24% | 30% | 31% | 29% | 38% | 37% | 46% | 34% | 42% |
| Wrong track | 88% | 79% | 73% | 71% | 66% | 64% | 65% | 56% | 57% | 50% | 61% | 51% |
| (VOL) Depends | 1% | 2% | 1% | 3% | 1% | 2% | 4% | 3% | 3% | 2% | 4% | 3% |
| (VOL) Don’t know | 1% | 2% | 2% | 2% | 3% | 3% | 2% | 4% | 3% | 2% | 2% | 4% |
| (n) | (978) | (807) | (809) | (794) | (808) | (811) | (802) | (804) | (810) | (800) | (802) | (809) |
| TREND: Continued | Nov. 2020 | Early Sept. 2020 | Aug. 2020 | Late June 2020 | Early June 2020 | May 2020 | April 2020 | March 2020 | Feb. 2020 | Jan. 2020 |
| Right direction | 26% | 27% | 22% | 18% | 21% | 33% | 30% | 39% | 37% | 37% |
| Wrong track | 68% | 66% | 72% | 74% | 74% | 60% | 61% | 54% | 57% | 56% |
| (VOL) Depends | 4% | 4% | 4% | 5% | 4% | 4% | 5% | 4% | 6% | 6% |
| (VOL) Don’t know | 2% | 3% | 2% | 3% | 1% | 3% | 5% | 3% | 1% | 1% |
| (n) | (810) | (867) | (868) | (867) | (807) | (808) | (857) | (851) | (902) | (903) |
| TREND: Continued | Dec. 2019 | Nov. 2019 | Sept. 2019 | Aug. 2019 | June 2019 | May 2019 | April 2019 | March 2019 | Nov. 2018 | Aug. 2018 | June 2018 | April 2018 | March 2018 | Jan. 2018 |
| Right direction | 32% | 30% | 30% | 28% | 31% | 29% | 28% | 29% | 35% | 35% | 40% | 33% | 31% | 37% |
| Wrong track | 56% | 61% | 61% | 62% | 62% | 63% | 62% | 63% | 55% | 57% | 53% | 58% | 61% | 57% |
| (VOL) Depends | 8% | 7% | 6% | 8% | 6% | 4% | 7% | 6% | 7% | 6% | 3% | 5% | 6% | 3% |
| (VOL) Don’t know | 4% | 2% | 2% | 2% | 2% | 3% | 3% | 2% | 3% | 3% | 3% | 4% | 1% | 3% |
| (n) | (903) | (908) | (1,161) | (800) | (751) | (802) | (801) | (802) | (802) | (805) | (806) | (803) | (803) | (806) |
TREND: Continued | Dec. 2017 | Aug. 2017 | May 2017 | March 2017 | Jan. 2017 | Aug. 2016* | Oct. 2015 | July 2015 | June 2015 | April 2015 | Dec. 2014 | July 2013 |
| Right direction | 24% | 32% | 31% | 35% | 29% | 30% | 24% | 28% | 23% | 27% | 23% | 28% |
| Wrong track | 66% | 58% | 61% | 56% | 65% | 65% | 66% | 63% | 68% | 66% | 69% | 63% |
| (VOL) Depends | 7% | 4% | 5% | 4% | 4% | 2% | 6% | 5% | 5% | 5% | 5% | 5% |
| (VOL) Don’t know | 3% | 5% | 3% | 5% | 2% | 3% | 4% | 3% | 3% | 2% | 3% | 4% |
| (n) | (806) | (805) | (1,002) | (801) | (801) | (803) | (1,012) | (1,001) | (1,002) | (1,005) | (1,008) | (1,012) |
* Registered voters
7.Turning to issues closer to home, what is the biggest concern facing your family right now? [LIST WAS NOT READ]
| TREND: | June 2022 | Dec. 2021 | July 2021 | Aug. 2020 | March 2020 | April 2019 | April 2018 | Jan. 2017 | Jan. 2015 |
| Inflation | 33% | 14% | 5% | n/a | n/a | n/a | n/a | n/a | n/a |
| Gas prices | 15% | n/a | n/a | n/a | n/a | n/a | n/a | n/a | n/a |
| The economy | 9% | 6% | 11% | 7% | 5% | 6% | 3% | 3% | 2% |
| Everyday bills, groceries, etc. | 6% | 15% | 11% | 8% | 6% | 8% | 12% | 12% | 16% |
| Abortion, reproductive rights | 5% | n/a | n/a | n/a | n/a | n/a | n/a | n/a | n/a |
| Guns, gun ownership | 3% | 0% | 0% | 0% | 0% | 1% | 2% | n/a | n/a |
| Health care costs | 3% | 5% | 7% | 4% | 5% | 19% | 13% | 25% | 15% |
| Job security, unemployment | 3% | 6% | 7% | 10% | 7% | 7% | 9% | 14% | 16% |
| College tuition, school costs | 2% | 1% | 2% | 1% | 0% | 3% | 4% | 4% | 10% |
| Housing, mortgage, rent | 2% | 2% | 3% | 2% | 1% | 2% | 4% | 3% | 4% |
| Safety, crime | 2% | 3% | 3% | 3% | 1% | 3% | 3% | 3% | 2% |
| Civil rights | 1% | 1% | 3% | 1% | 0% | 3% | 1% | 3% | n/a |
| Climate change, environment | 1% | 2% | 3% | 0% | 1% | 3% | 1% | 1% | n/a |
| Coronavirus/COVID-19 | 1% | 18% | 17% | 39% | 57% | n/a | n/a | n/a | n/a |
| Education policy | 1% | 1% | 3% | 3% | 1% | 2% | 2% | 1% | 2% |
| Family illness, health | 1% | 4% | 3% | 4% | 3% | 3% | 3% | 3% | 4% |
| Quality of government | 1% | 4% | 3% | 3% | 0% | 2% | 3% | 1% | 2% |
| Social Security, seniors | 1% | 1% | 1% | 1% | 0% | 3% | 3% | 3% | 2% |
| Taxes | 1% | 2% | 3% | 1% | 1% | 9% | 7% | 4% | 7% |
| Immigration | 0% | 1% | 2% | 0% | 0% | 5% | 4% | 3% | 1% |
| Retirement saving | 0% | 0% | 0% | 1% | 0% | 0% | 1% | 2% | 3% |
| Terrorism, national security | 0% | 0% | 1% | 1% | 0% | 1% | 2% | 2% | 1% |
| Other | 5% | 2% | 3% | 4% | 3% | 6% | 6% | 3% | 4% |
| Don’t know/No answer | 6% | 11% | 9% | 8% | 9% | 16% | 15% | 10% | 8% |
| (n) | (978) | (808) | (804) | (868) | (851) | (801) | (803) | (801) | (1,003) |
[Question 8 was asked only of those who mentioned a concern in Q7: n=931, moe=+/-3.2 %]
8.Thinking about this most important concern, have the actions of the federal government over the past six months helped, hurt, or had no real impact on this concern?
| TREND: | June 2022 | Dec. 2021* | July 2021 | April 2019** | April 2018** | Jan. 2017*** | Jan. 2015*** |
| Helped | 8% | 25% | 31% | 14% | 14% | 27% | 14% |
| Hurt | 57% | 46% | 34% | 42% | 39% | 37% | 47% |
| No real impact | 34% | 27% | 31% | 42% | 44% | 34% | 38% |
| (VOL) Don’t know | 1% | 2% | 3% | 2% | 3% | 2% | 2% |
| (n) | (931) | (747) | (730) | (692) | (680) | (728) | (926) |
* Dec. 2021 asked about “since the beginning of the year”
** 2019 and 2018 asked about “the past year”
*** 2017 and 2015 asked about “the past few years”
[Question 9 was asked only of those who mentioned a concern in Q7: n=931, moe=+/-3.2%]
9.And do you think the actions of the federal government over the next few years will help, hurt, or have no real impact on this concern?
| TREND: | June 2022 | July 2021 | April 2019 | April 2018 | Jan. 2017 |
| Help | 23% | 40% | 29% | 26% | 42% |
| Hurt | 45% | 34% | 32% | 36% | 33% |
| No real impact | 20% | 18% | 26% | 27% | 21% |
| (VOL) Don’t know | 12% | 8% | 13% | 11% | 4% |
| (n) | (931) | (730) | (692) | (680) | (728) |
10.Thinking about your current financial situation, would you say you are struggling to remain where you are financially, basically stable in your current financial situation, or is your financial situation improving?
| TREND: | June 2022 | June 2021 | Late June 2020 | Early June 2020 | May 2020 | April 2020 | March 2020 | April 2019 | April 2018 | Jan. 2017 |
| Struggling | 42% | 24% | 22% | 20% | 23% | 26% | 26% | 20% | 24% | 29% |
| Stable | 47% | 58% | 61% | 65% | 63% | 62% | 61% | 54% | 51% | 51% |
| Improving | 9% | 14% | 17% | 13% | 13% | 11% | 11% | 25% | 23% | 20% |
| (VOL) Don’t know | 1% | 3% | 1% | 1% | 1% | 2% | 1% | 1% | 2% | 0% |
| (n) | (978) | (810) | (867) | (807) | (808) | (857) | (851) | (801) | (803) | (801) |
11.How much have each of the following groups benefited from President Biden’s policies so far. [READ ITEM] – Have they benefited a lot, a little, or not at all? [ITEMS WERE ROTATED]
Middle class families
| COMPARISON: | Benefited under Trump | Benefited under Obama | ||||||||||
| June 2022 | Nov. 2021 | July 2021 | June 2021 | Jan. 2021 | April 2019 | April 2018 | Dec. 2017 | Jan. 2017 | July 2013 | |||
| A lot | 7% | 14% | 21% | 19% | 32% | 18% | 14% | 11% | 24% | 12% | ||
| A little | 34% | 39% | 41% | 32% | 33% | 37% | 45% | 25% | 41% | 39% | ||
| Not at all | 54% | 42% | 33% | 36% | 32% | 36% | 36% | 53% | 33% | 46% | ||
| (VOL) Don’t know | 5% | 5% | 5% | 14% | 3% | 9% | 5% | 11% | 2% | 2% | ||
| (n) | (978) | (811) | (804) | (810) | (809) | (801) | (803) | (806) | (801) | (1,012) | ||
Wealthy families
| COMPARISON: | Benefited under Trump | Benefited under Obama | |||||||
| June 2022 | Nov. 2021 | July 2021 | April 2019 | April 2018 | Jan. 2017 | July 2013 | |||
| A lot | 28% | 25% | 22% | 58% | 57% | 29% | 35% | ||
| A little | 25% | 28% | 30% | 22% | 26% | 43% | 31% | ||
| Not at all | 35% | 32% | 35% | 9% | 7% | 17% | 23% | ||
| (VOL) Don’t know | 12% | 14% | 14% | 11% | 10% | 10% | 10% | ||
| (n) | (978) | (811) | (804) | (801) | (803) | (801) | (1,012) | ||
Poor families
| COMPARISON: | Benefited under Trump | Benefited under Obama | |||||||
| June 2022 | Nov. 2021 | July 2021 | April 2019 | April 2018 | Jan. 2017 | July 2013 | |||
| A lot | 13% | 22% | 31% | 14% | 12% | 39% | 20% | ||
| A little | 30% | 38% | 35% | 26% | 28% | 36% | 39% | ||
| Not at all | 52% | 36% | 29% | 51% | 53% | 21% | 37% | ||
| (VOL) Don’t know | 5% | 4% | 5% | 9% | 7% | 4% | 4% | ||
| (n) | (978) | (811) | (804) | (801) | (803) | (801) | (1,012) | ||
[Q12-21 held for future release.]
[Q22-40 previously released.]
METHODOLOGY
The Monmouth University Poll was sponsored and conducted by the Monmouth University Polling Institute from June 23 to 27, 2022 with a probability-based national random sample of 978 adults age 18 and older. This includes 343 contacted by a live interviewer on a landline telephone and 635 contacted by a live interviewer on a cell phone, in English. Telephone numbers were selected through a mix of random digit dialing and list-based sampling. Landline respondents were selected with a modified Troldahl-Carter youngest adult household screen. Interviewing services were provided by Braun Research, with sample obtained from Dynata (RDD, n=565), Aristotle (list, n=168) and a panel of prior Monmouth poll participants (n=245). Monmouth is responsible for all aspects of the survey design, data weighting and analysis. The full sample is weighted for region, age, education, gender and race based on US Census information (ACS 2018 one-year survey). For results based on this sample, one can say with 95% confidence that the error attributable to sampling has a maximum margin of plus or minus 3.1 percentage points (unadjusted for sample design). Sampling error can be larger for sub-groups (see table below). In addition to sampling error, one should bear in mind that question wording and practical difficulties in conducting surveys can introduce error or bias into the findings of opinion polls.
DEMOGRAPHICS (weighted) |
| Self-Reported |
| 26% Republican |
| 43% Independent |
| 31% Democrat |
| 49% Male |
| 51% Female |
| 30% 18-34 |
| 33% 35-54 |
| 37% 55+ |
| 63% White |
| 12% Black |
| 16% Hispanic |
| 9% Asian/Other |
| 69% No degree |
| 31% 4 year degree |
Click on pdf file link below for full methodology and crosstabs by key demographic groups.


