It’s a truism that Americans rate their own Congressional representatives more positively than the institution as a whole. An NBC News/Wall Street Journal Poll released last week bears that out.
Congress as a whole received an abysmal 17% job approval rating in the poll. Other polls released over the past few weeks showed between 14% and 26% of Americans approving of the Capitol Hill’s performance, with fully 70% to 80% registering disapproval.
Those numbers are low, but not entirely unprecedented. In the run-up to the 2008 election, Congressional approval ratings in the teens and low twenties were fairly common. And Congressional approval is rarely all that high any way. From the 1980s through the mid-1990s, positive opinion of the legislative branch hovered in the upper thirties to low forties. By the late 1990s, those numbers frequently topped the 50% mark, but went on a quick decline in the mid-2000s.
Unlike the other recent polls, though, the NBC/WSJ poll also asked respondents to “rate the congressman or woman from [their] district?” Those results were 45% approve to 41% disapprove. While that is certainly better than the 17% to 77% rating for Congress as a whole, the results still seemed low.
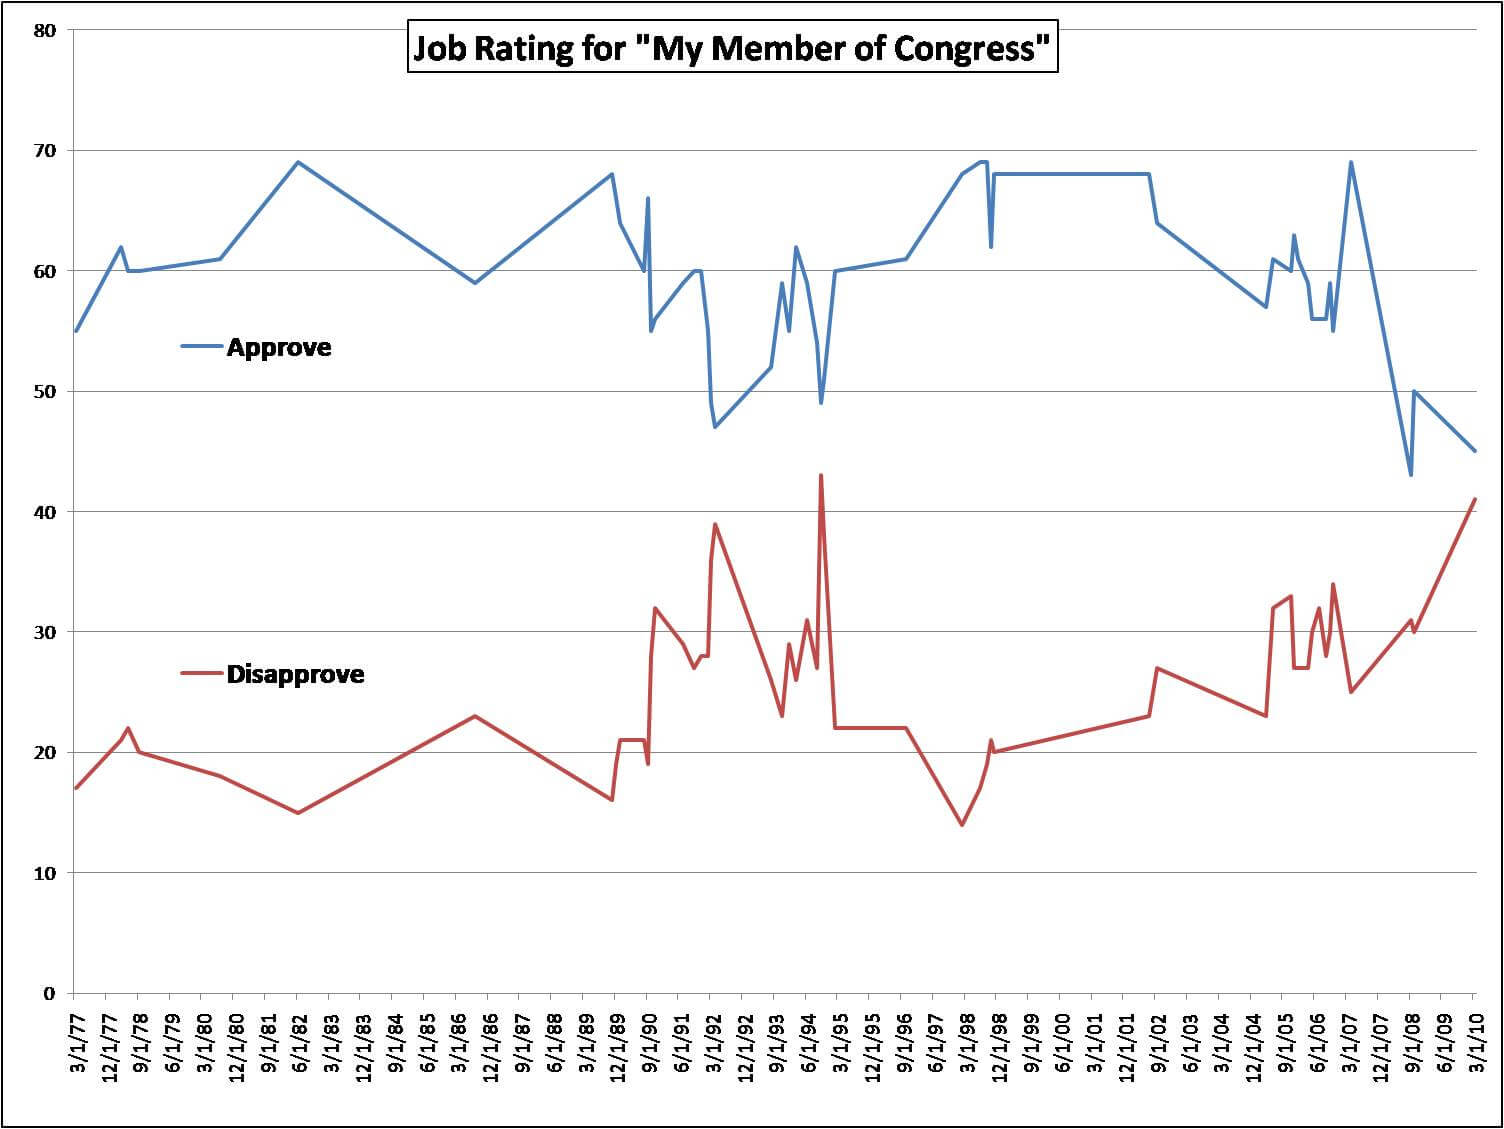
So I did a quick search. The “my member of Congress” question is not asked as frequently as the institutional job performance question, but the trend line indicates that the NBC/WSJ result is among the lowest recorded in national polls, since at least the mid-1970s (see chart below).
For most of the past 30 years, generic approval of the job done by “the representative from my district” lingered in the low 60s. We’ve seen that generally decline over the past five years – with one positive spike in 2007. The trend also indicates there was a great deal of volatility between 1991 and 1994, although “my member” approval rarely dipped below 50%.
Moreover, I found only two instances where the approve/disapprove gap was nearly as small as the 4 point margin in the recent NBC/WSJ poll: a Times-Mirror Poll from March 1992 (45% approve to 37% disapprove) and an ABC/Washington Post Poll from October 1994 (49% approve to 43% disapprove).
Both of these prior polls are instructive. The 1992 result was registered a few months before the election that saw Bill Clinton defeat incumbent George H.W. Bush during an economic downturn. Clinton’s victory was unusual because – unlike his modern predecessors – he had no coattails. His party actually lost a handful of seats in the House of Representatives that year.
And then we all know what happened in the next election cycle. The 1994 midterm saw the Republicans pick up a whopping 54 seats to gain control of the House.
So will 2010 be like 1994?
There are some who look at the party ratings – Republican approval ratings are worse than the Democrats – as evidence that this year won’t be like 1994. However, the Republicans were also polling lower than the Democrats in 1994. An ABC/Washington Post poll right before that election gave Congressional Democrats a net negative 14 point rating and their GOP counterparts an even worse net negative 26 point rating.
At the end of the day, voters elect individual members of Congress, not the party. A number of incumbents are consistently successful in overcoming their party’s negative ratings. But trouble is definitely brewing when the “my member” job approval number drops below 50%.
The question now is whether passage of the health care reform bill will change the outlook for this November. That depends on whether independent voters see the bill as good or bad for themselves. Up until now, their opinion has been mainly negative. But passage of landmark legislation can have a strange effect on voters.
Independents say they want bipartisan action, but at the end of the day, they’ll take any action over inaction. On Sunday, the Democrats seemed to demonstrate that they can actually get something major accomplished, and some voters may give them credit for that. Polls coming out in the next few days and week will tell us whether that is the case.
But the prospect that this deal could help Democrats is why the Senate reconciliation process will be a political football. It’s not so much that voters are concerned about the individual “fixes” in that legislation. The Republicans realize that undermining the Senate Democrats’ bargain with their House colleagues could douse any burgeoning positive opinion for the majority party generated by passage of the bill.
That may not be the best way to make policy, but it’s certainly a good way to gain political advantage.