Retention and graduation rates are calculated on groups of first-time full-time freshmen who enter Monmouth in the fall semester. With rare exception, all first-time freshmen entering Monmouth start as full-time students.
Retention Rate
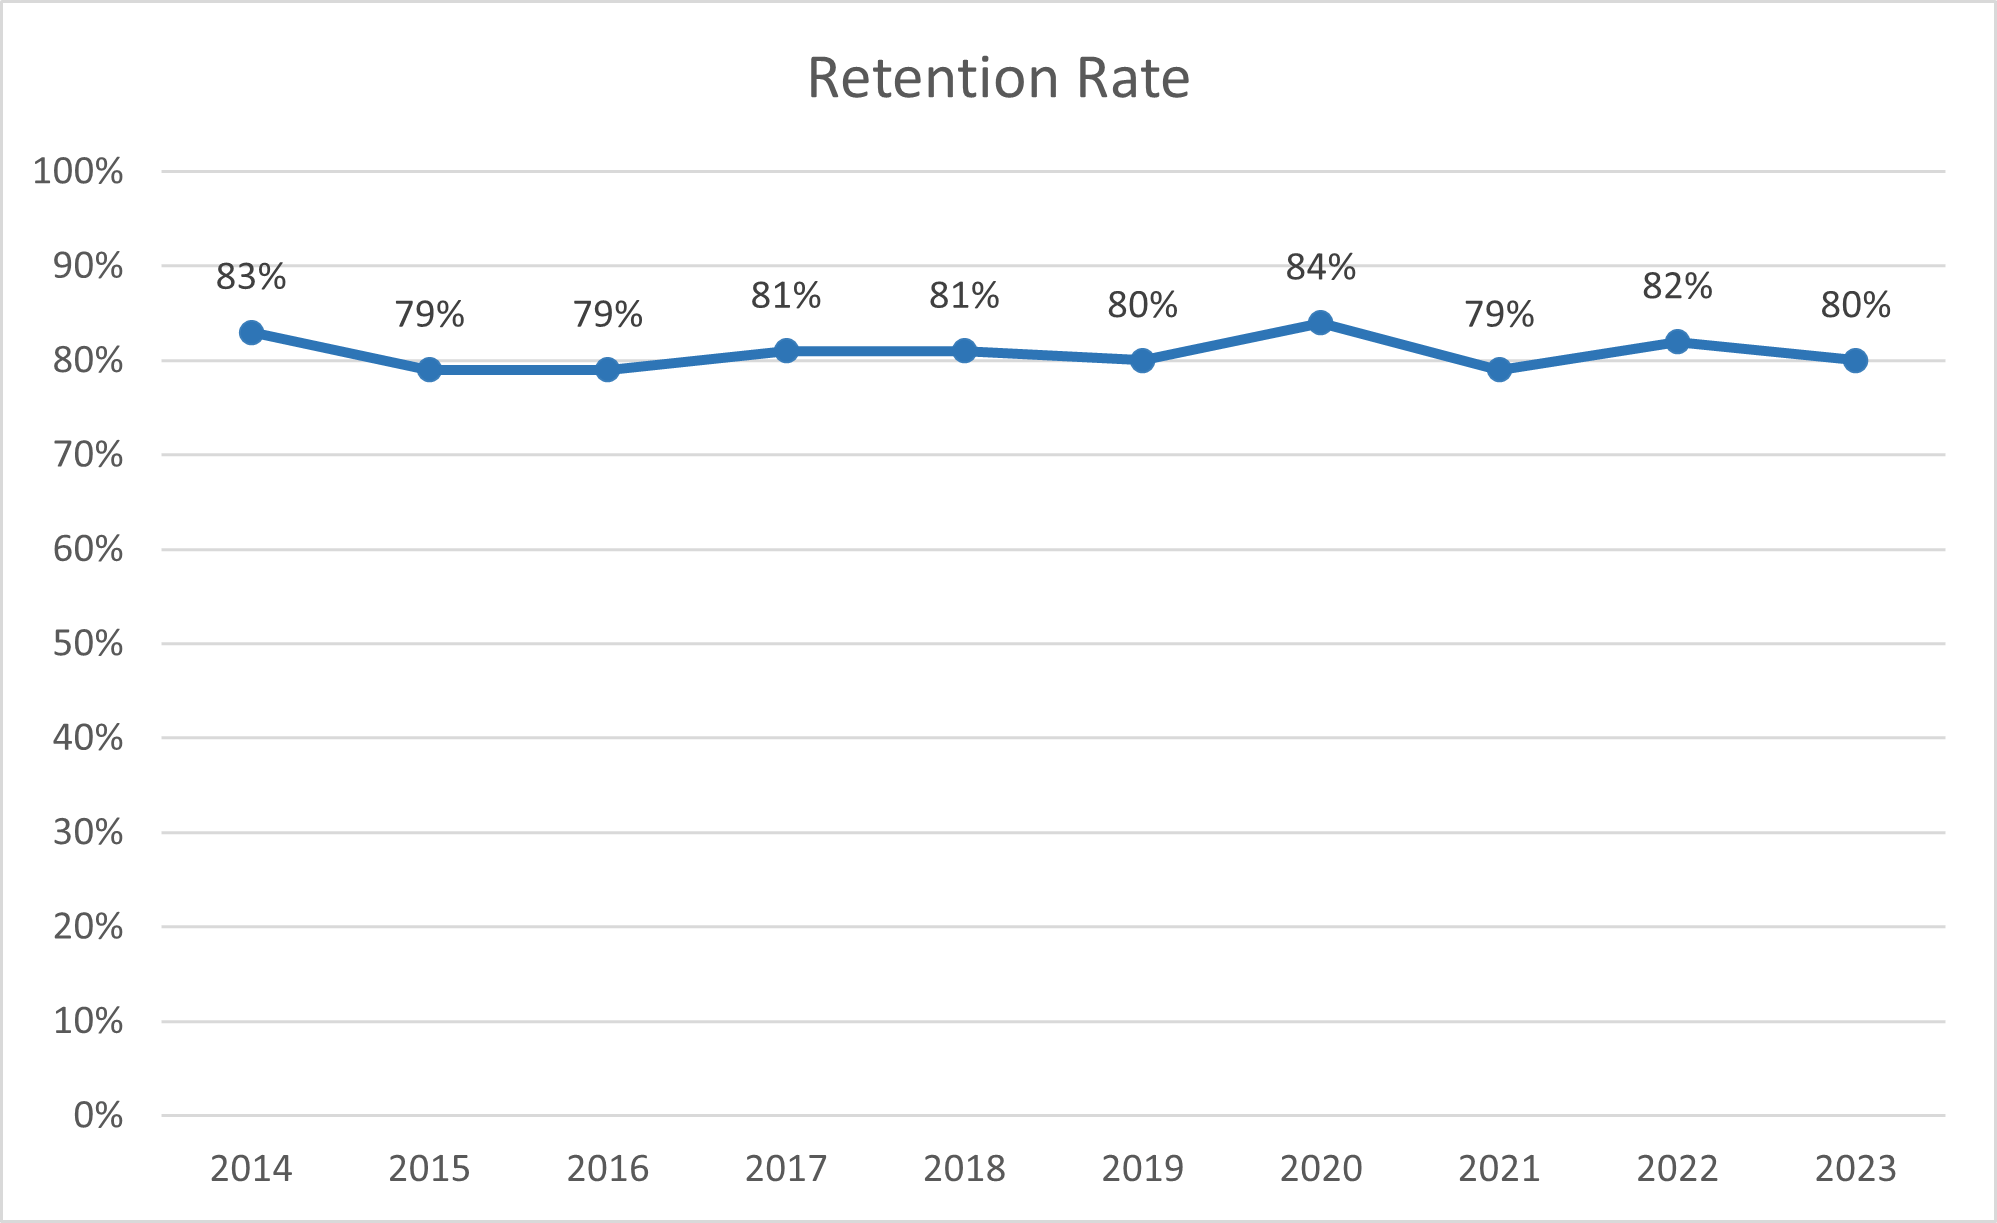
The retention rate is the percentage of a group of first-time full-time freshmen entering in the fall of the year noted in the chart who enrolled the following fall semester. Eighty percent of the first-time full-time freshmen who entered in fall 2023 returned to Monmouth in the fall of 2024.
Data Table
| Year | Retention Rate |
|---|---|
| 2014 | 83% |
| 2015 | 79% |
| 2016 | 79% |
| 2017 | 81% |
| 2018 | 81% |
| 2019 | 80% |
| 2020 | 84% |
| 2021 | 79% |
| 2022 | 82% |
| 2023 | 80% |
6 Year Graduation Rate
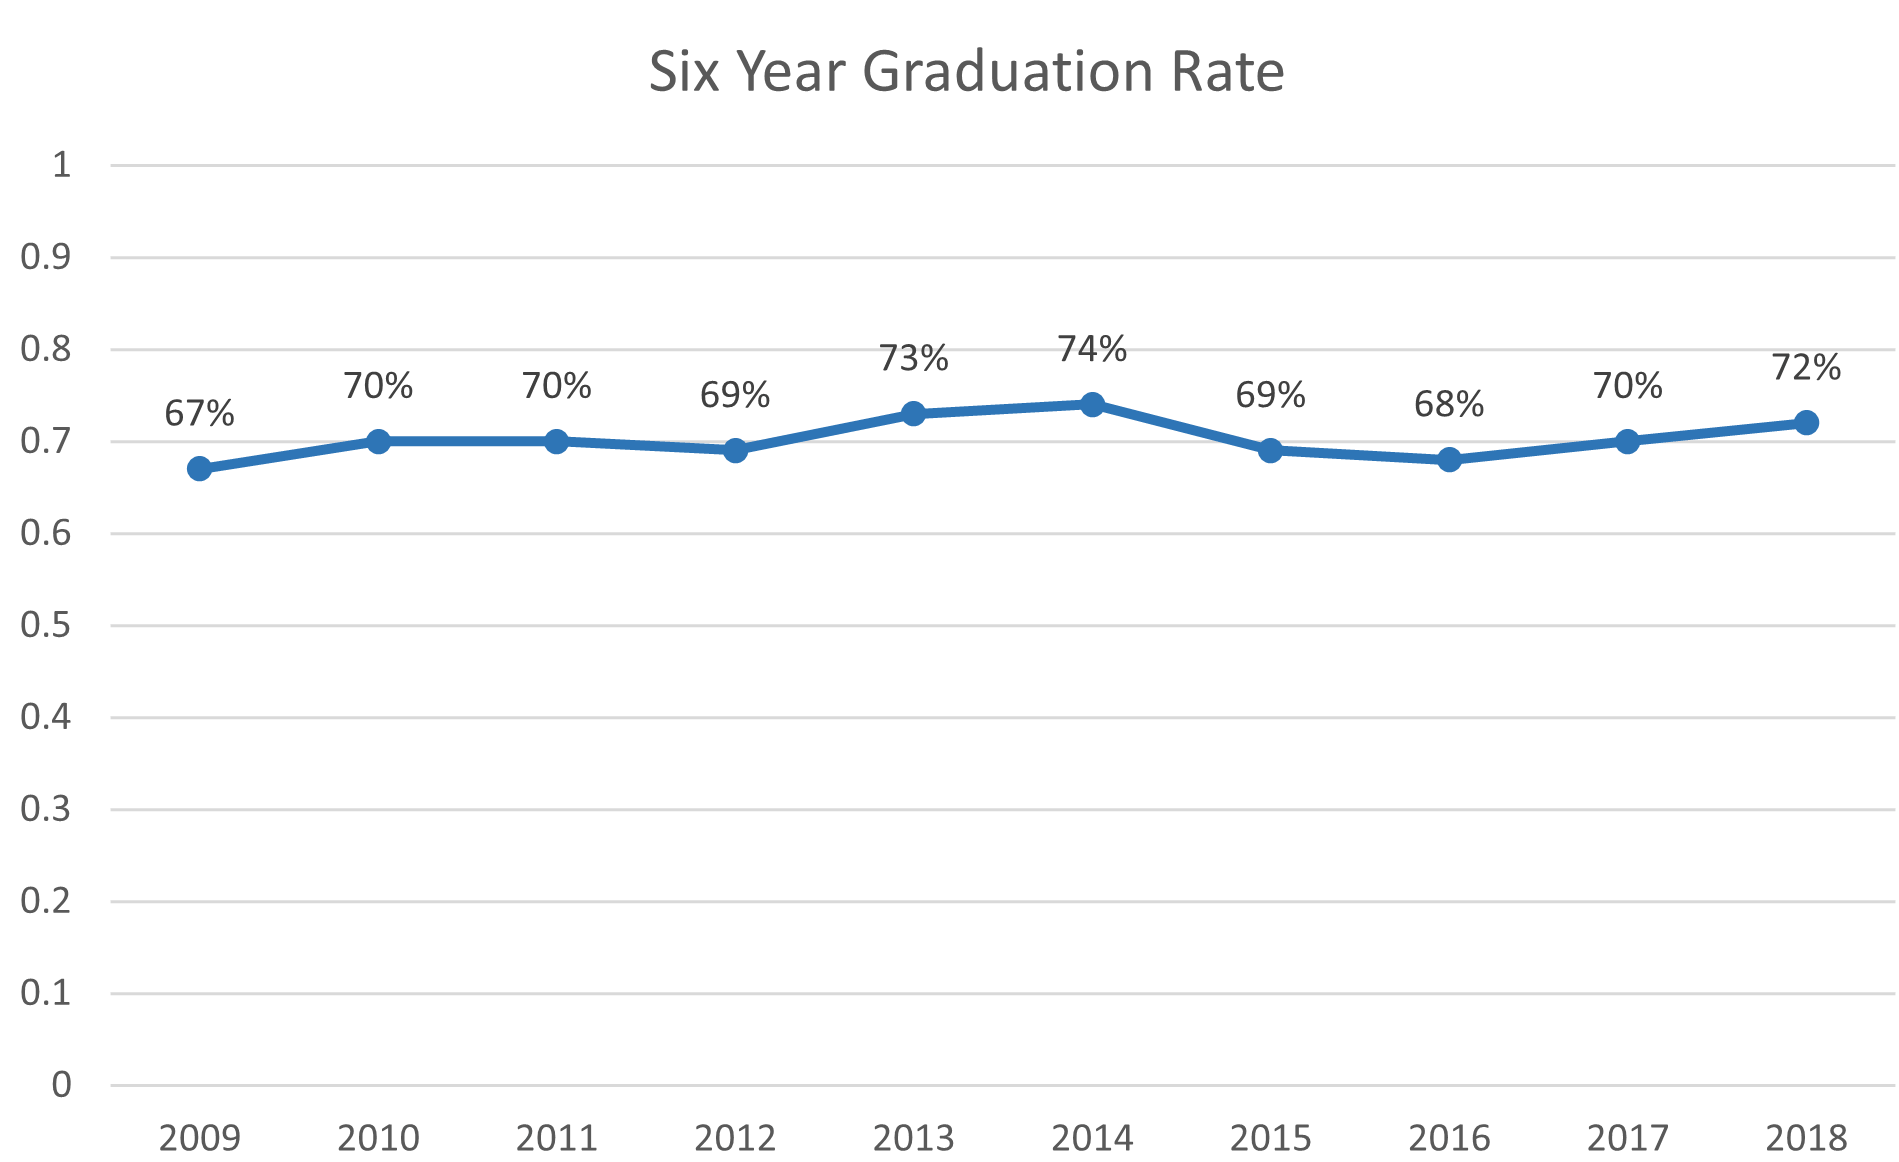
The graduation rate indicates the percentage of a group of first-time, full-time freshmen who graduated by Aug. 31 six years following their first fall semester. Seventy-two percent of the first-time, full-time freshmen who entered in the fall of 2018 graduated by Aug. 31, 2024.
Data Table
| Year | 6-Year Graduation Rate |
|---|---|
| 2009 | 67% |
| 2010 | 70% |
| 2011 | 70% |
| 2012 | 69% |
| 2013 | 73% |
| 2014 | 74% |
| 2015 | 69% |
| 2016 | 68% |
| 2017 | 70% |
| 2018 | 72% |
By Gender
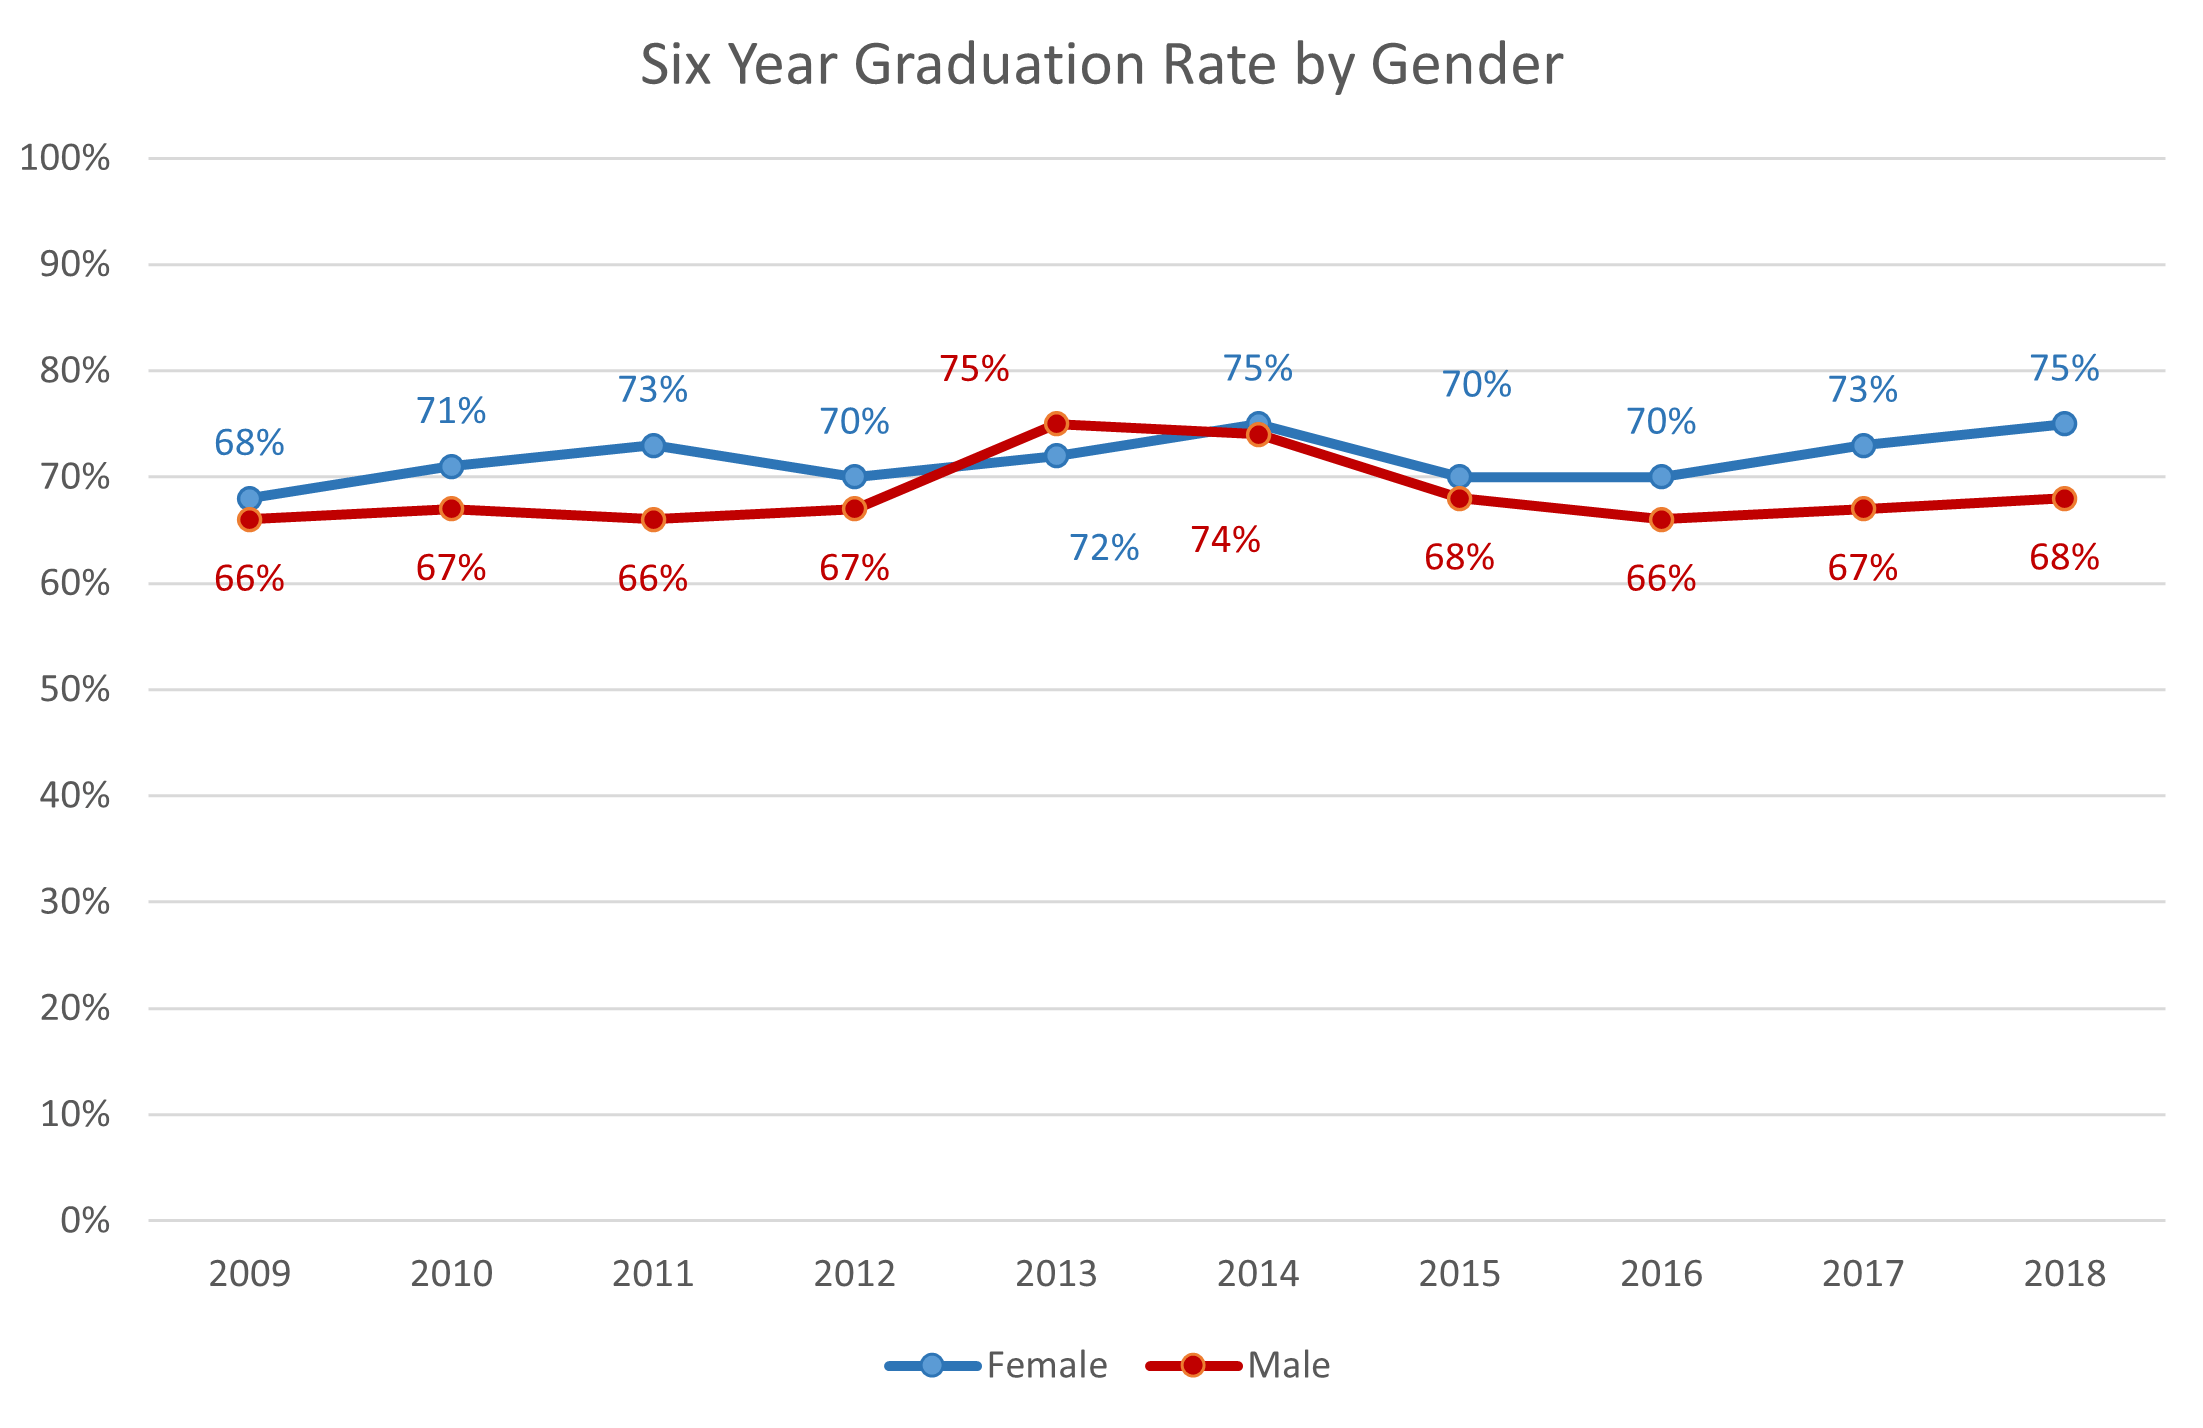
Over the past decade, women have usually graduated at a higher rate than men. For the group of freshmen entering in 2018, women again graduated at a slightly higher rate (75%) than men (68%).
Data Table
| Year | Female | Male |
|---|---|---|
| 2009 | 68% | 66% |
| 2010 | 71% | 67% |
| 2011 | 73% | 66% |
| 2012 | 70% | 67% |
| 2013 | 72% | 75% |
| 2014 | 75% | 74% |
| 2015 | 70% | 68% |
| 2016 | 70% | 66% |
| 2017 | 73% | 67% |
| 2018 | 75% | 68% |
By Race/Ethnic Group
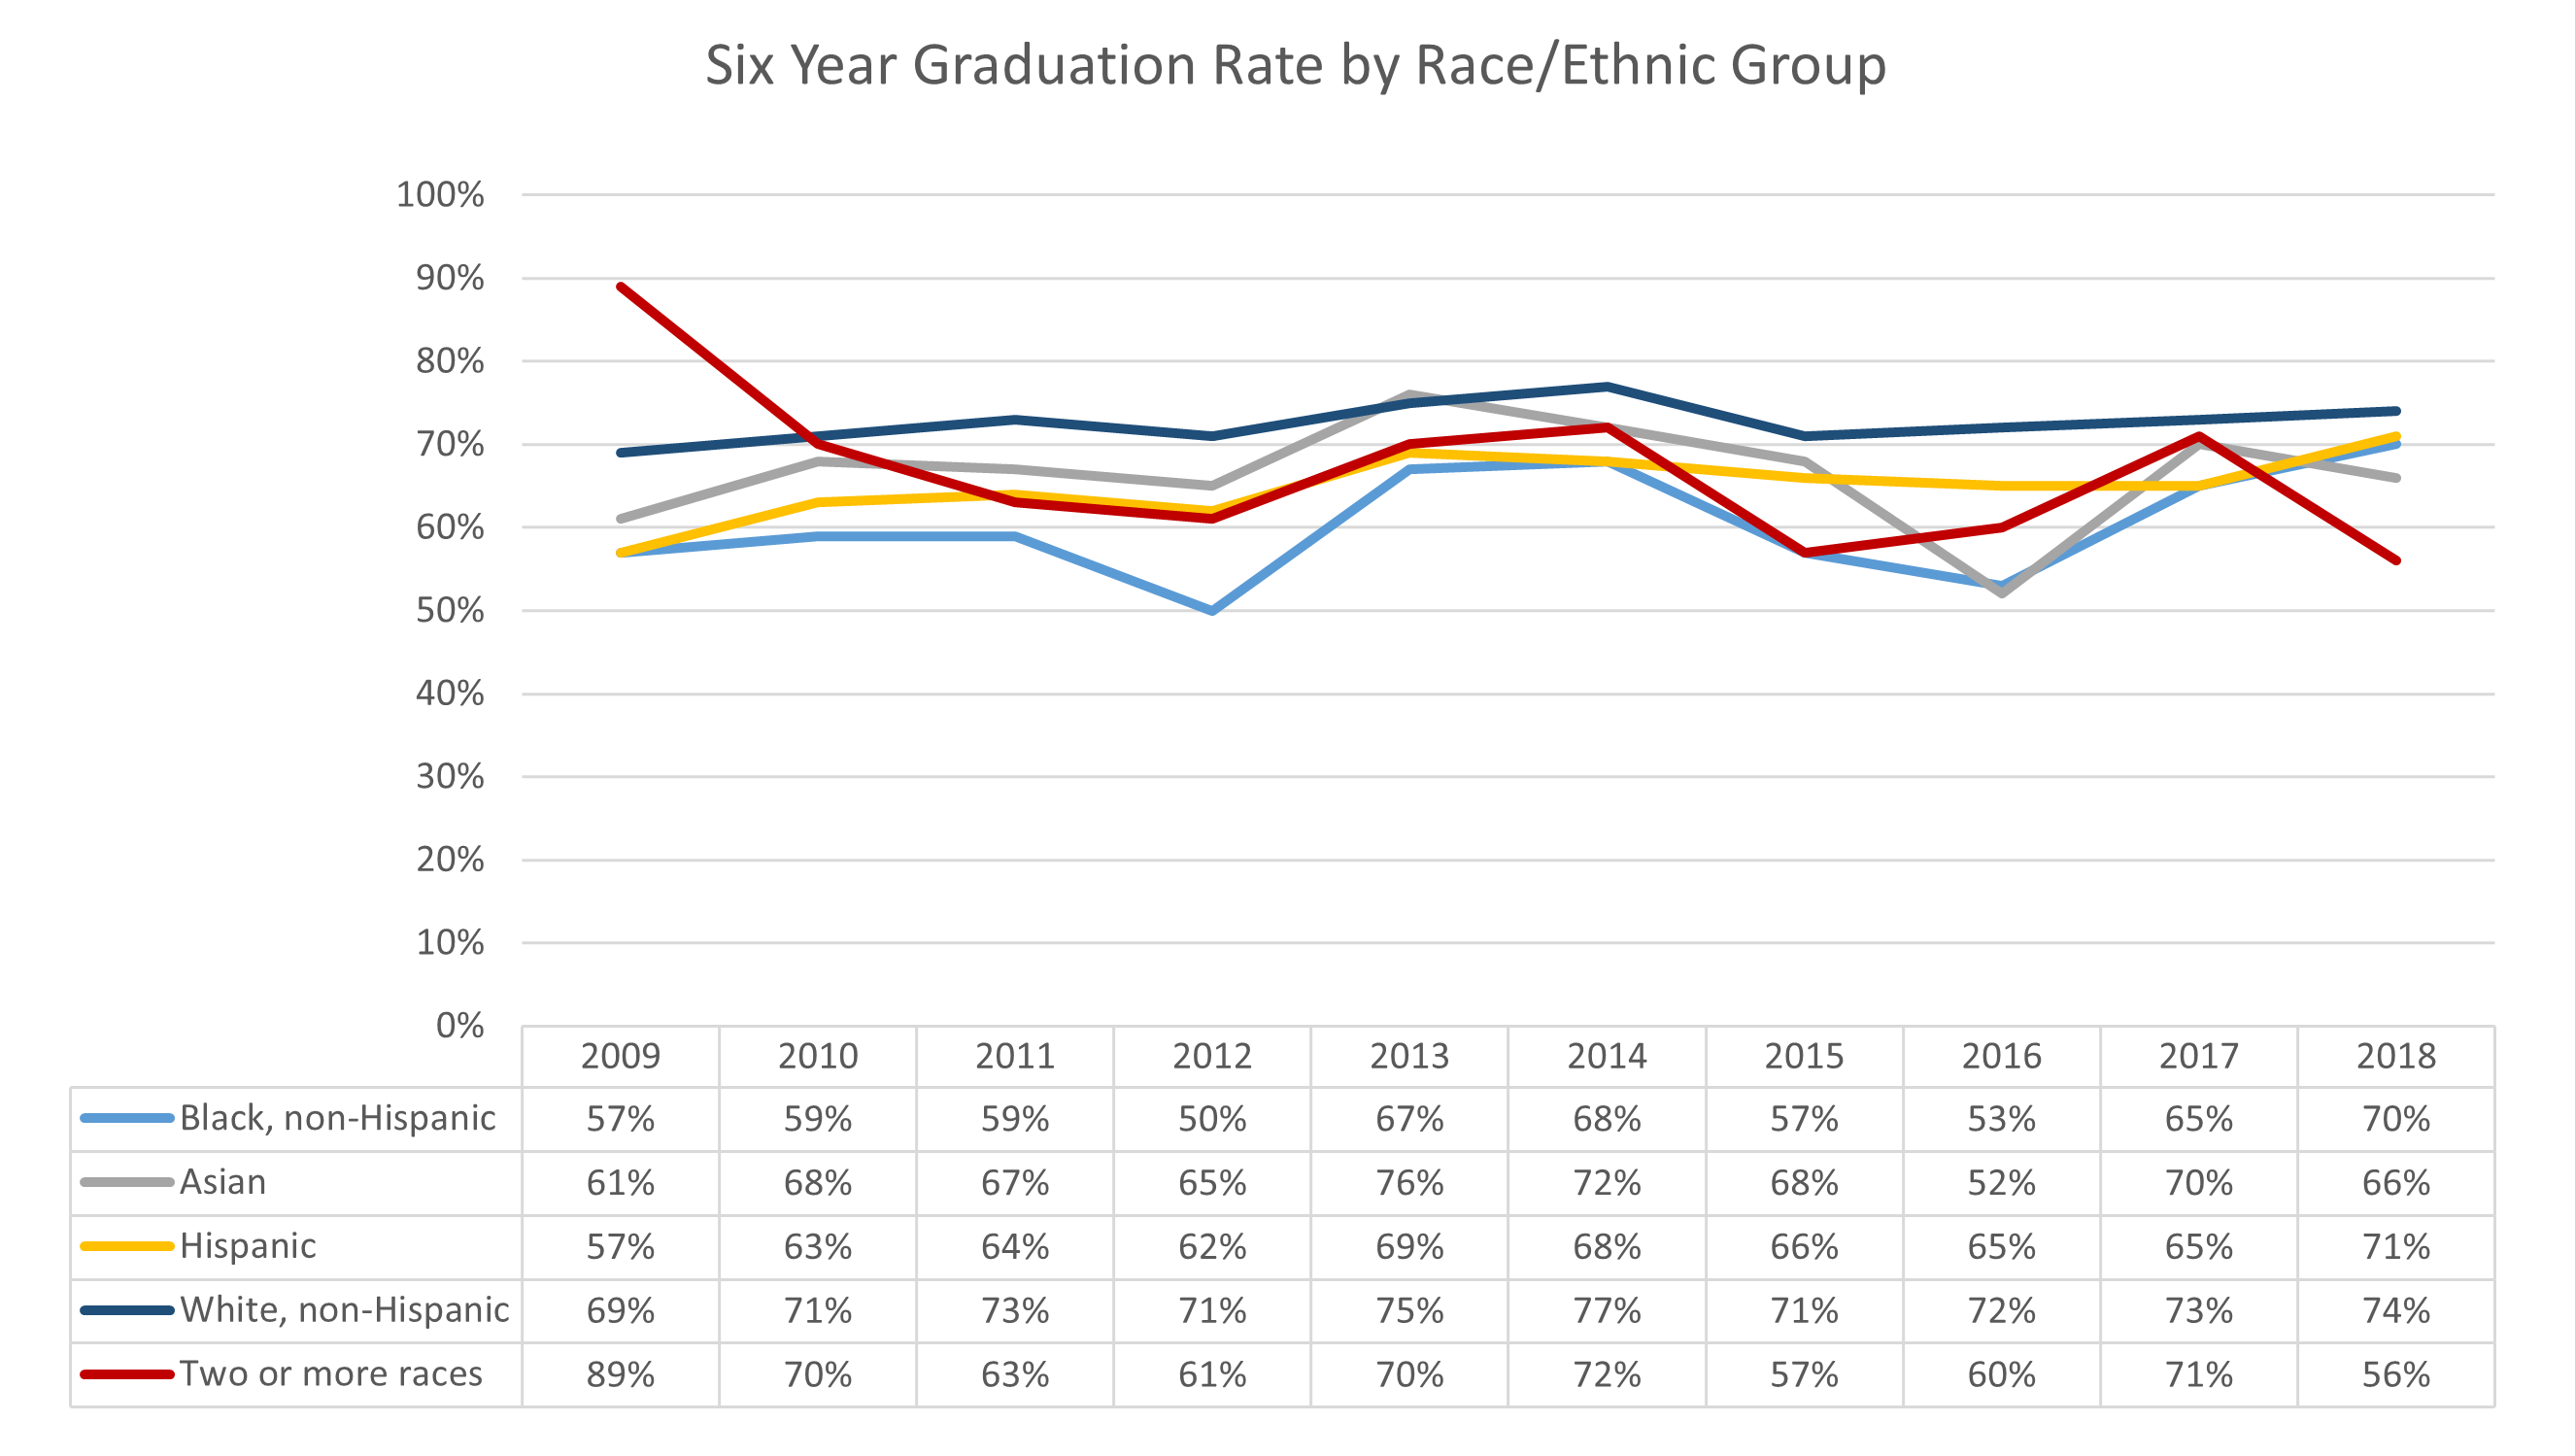
Graduation rates for the main race/ethnic groups at Monmouth often fluctuate sharply from one year to the next due to the relatively small sizes of some of the groups. The trends in the six year graduation rates of the groups over the last decade may be seen in the chart below.
Data Table
| Year | Black, Non-Hispanic | Asian | Hispanic | White, Non-Hispanic | Two or More Races |
|---|---|---|---|---|---|
| 2009 | 57% | 61% | 57% | 69% | 89% |
| 2010 | 59% | 68% | 63% | 71% | 70% |
| 2011 | 59% | 67% | 64% | 73% | 63% |
| 2012 | 50% | 65% | 62% | 71% | 61% |
| 2013 | 67% | 76% | 69% | 75% | 70% |
| 2014 | 68% | 72% | 68% | 77% | 72% |
| 2015 | 57% | 68% | 66% | 71% | 57% |
| 2016 | 53% | 52% | 65% | 72% | 60% |
| 2017 | 65% | 70% | 65% | 73% | 71% |
| 2018 | 70% | 66% | 71% | 74% | 56% |
By Pell Grant, Direct Subsidized Loan, or Neither
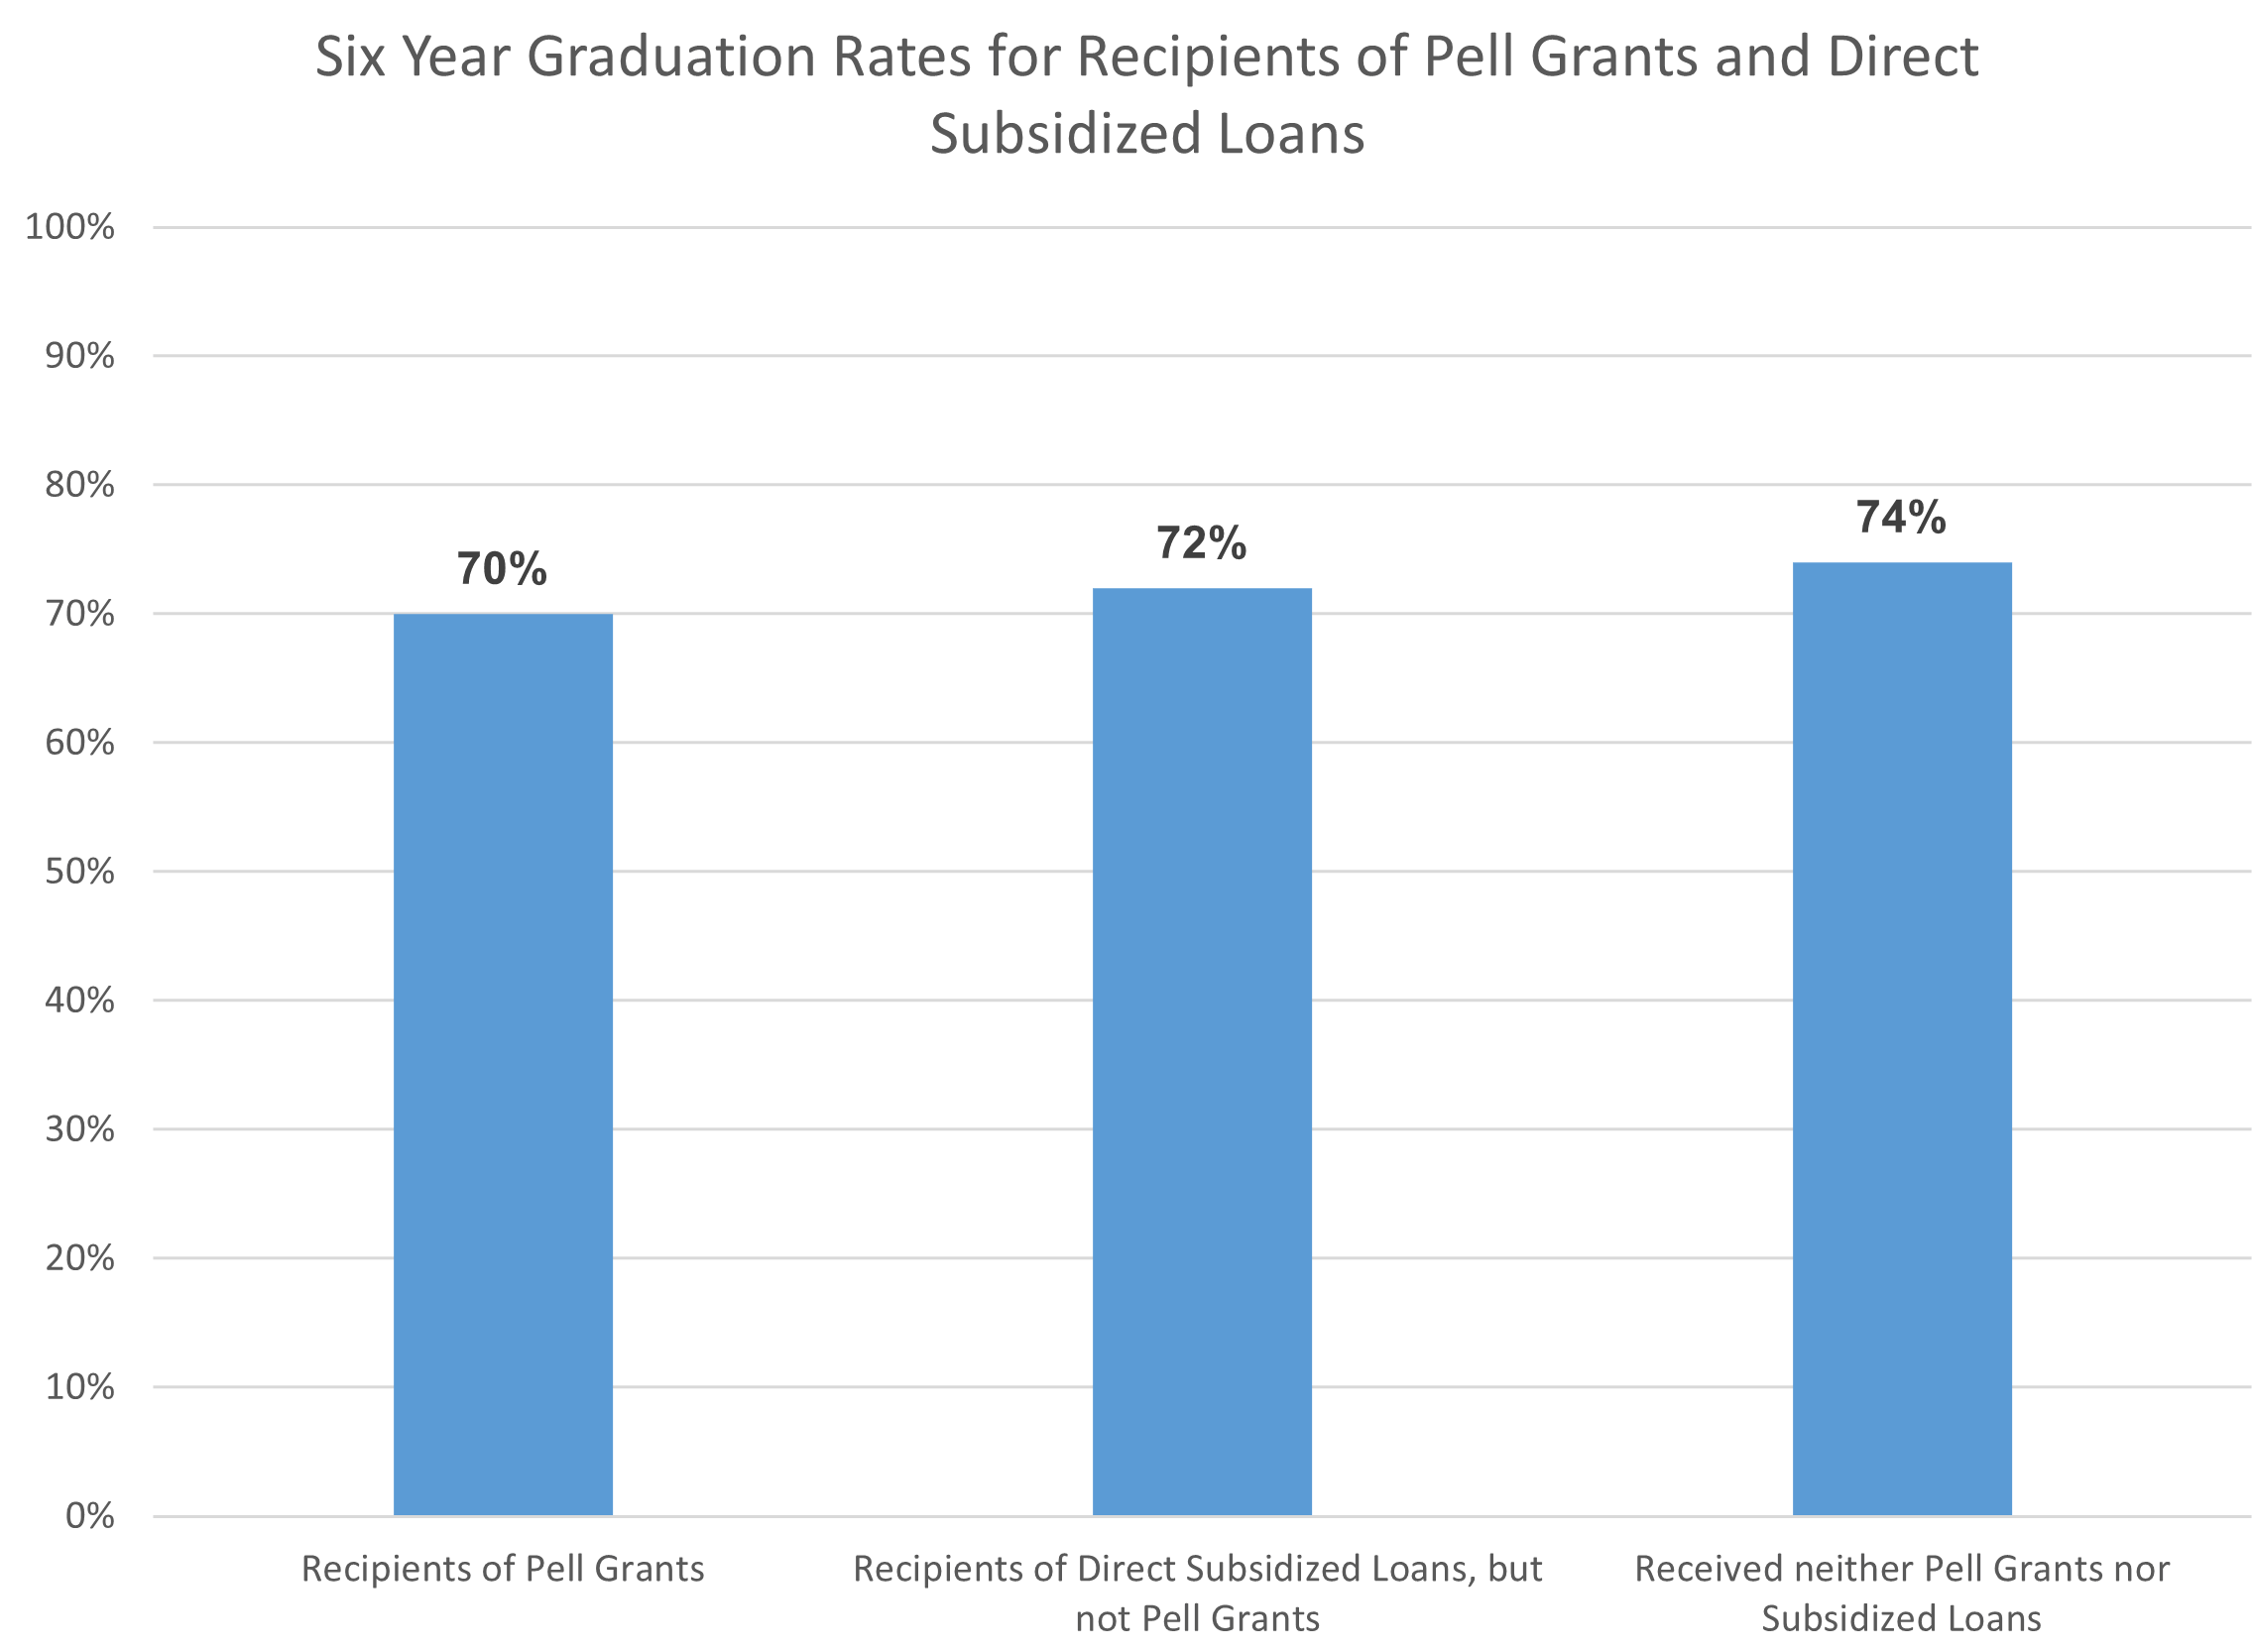
The final chart compares the six year graduation rates of fall 2018 first-time freshmen who received either a Pell Grant or Direct Subsidized Loan with students who received neither.
Data Table
| 2018 Cohort | Rate |
|---|---|
| Recipients of Pell Grants | 70% |
| Recipients of Direct Subsidized Loans, but not Pell Grants | 72% |
| Received neither Pell Grants nor Subsidized Loans | 74% |
In compliance with regulations governing NCAA Division 1 athletics, Monmouth University annually reports graduation information on students receiving athletically-related aid to the NCAA. This information may be found on the Graduation Success Rate search page of the NCAA website.