Drill, Baby, Drill?
Examining a new poll on energy and the coast.
Just days into 2018, the Trump administration released a draft proposal detailing an ambitious plan: The federal government would seek to open almost all U.S. coastal water to gas and oil drilling. The proposal is an effort to develop more domestic energy sources, but the move pins environmentalists and activists against developers and drillers.
On one side, a hope to become an energy powerhouse. “Under President Trump, we are going to become the strongest energy superpower this world has ever known,” Interior Secretary Ryan Zinke told Bloomberg. “We want to grow our nation’s offshore energy industry, instead of slowly surrendering it to foreign shores.”
On the other side, a major concern about the environment and coastal towns—areas that fear negative side effects to their tourism and fishing industries. “This radical offshore drilling free-for-all is a clear example of politics over people, ignoring widespread local and state opposition,” Diane Hoskinsm, a campaign director for the marine conservation group Oceana, told Bloomberg.
While the two sides duke it out, we turn to stats and two recent polls—collaborations between Monmouth’s Polling Institute and Urban Coast Institute—to see how people living in coastal towns in Maryland, Delaware, New York, New Jersey, Virginia, and Pennsylvania feel about the water in their backyard, its care at the state and federal level, and its future.
Down to the Facts

509: The number of oil rig fires that erupted between 2006 and April 2010, the month of the Deepwater Horizon disaster, the largest offshore oil spill in U.S. history.134 million: The number of gallons spilled in that disaster
$18.7 billion: BP’s payout for federal and state claims resulting from the spill. The money was divvied up between clean-up projects and the restoration of natural resources, claims from the five Gulf states and 400 local government bodies, and a hefty Clean Water Act penalty
35: The percentage of respondents in a recent Monmouth poll who said they have either “a great deal” or “some” confidence in how the federal government will handle coastal management issues over the next few years (as of 2017).61: The percentage of respondents who had either “little” or “no” confidence in the federal government’s handling of these issues.

94: The percentage of the outer continental shelf that the Obama administration blocked for drilling.90: The percentage of those waters that could soon be free game under the Trump plan.

54: Percentage of respondents who said loosening restrictions (those in place as of 2017) would be a “bad idea.”20: The percentage who said it’s a “good idea.”

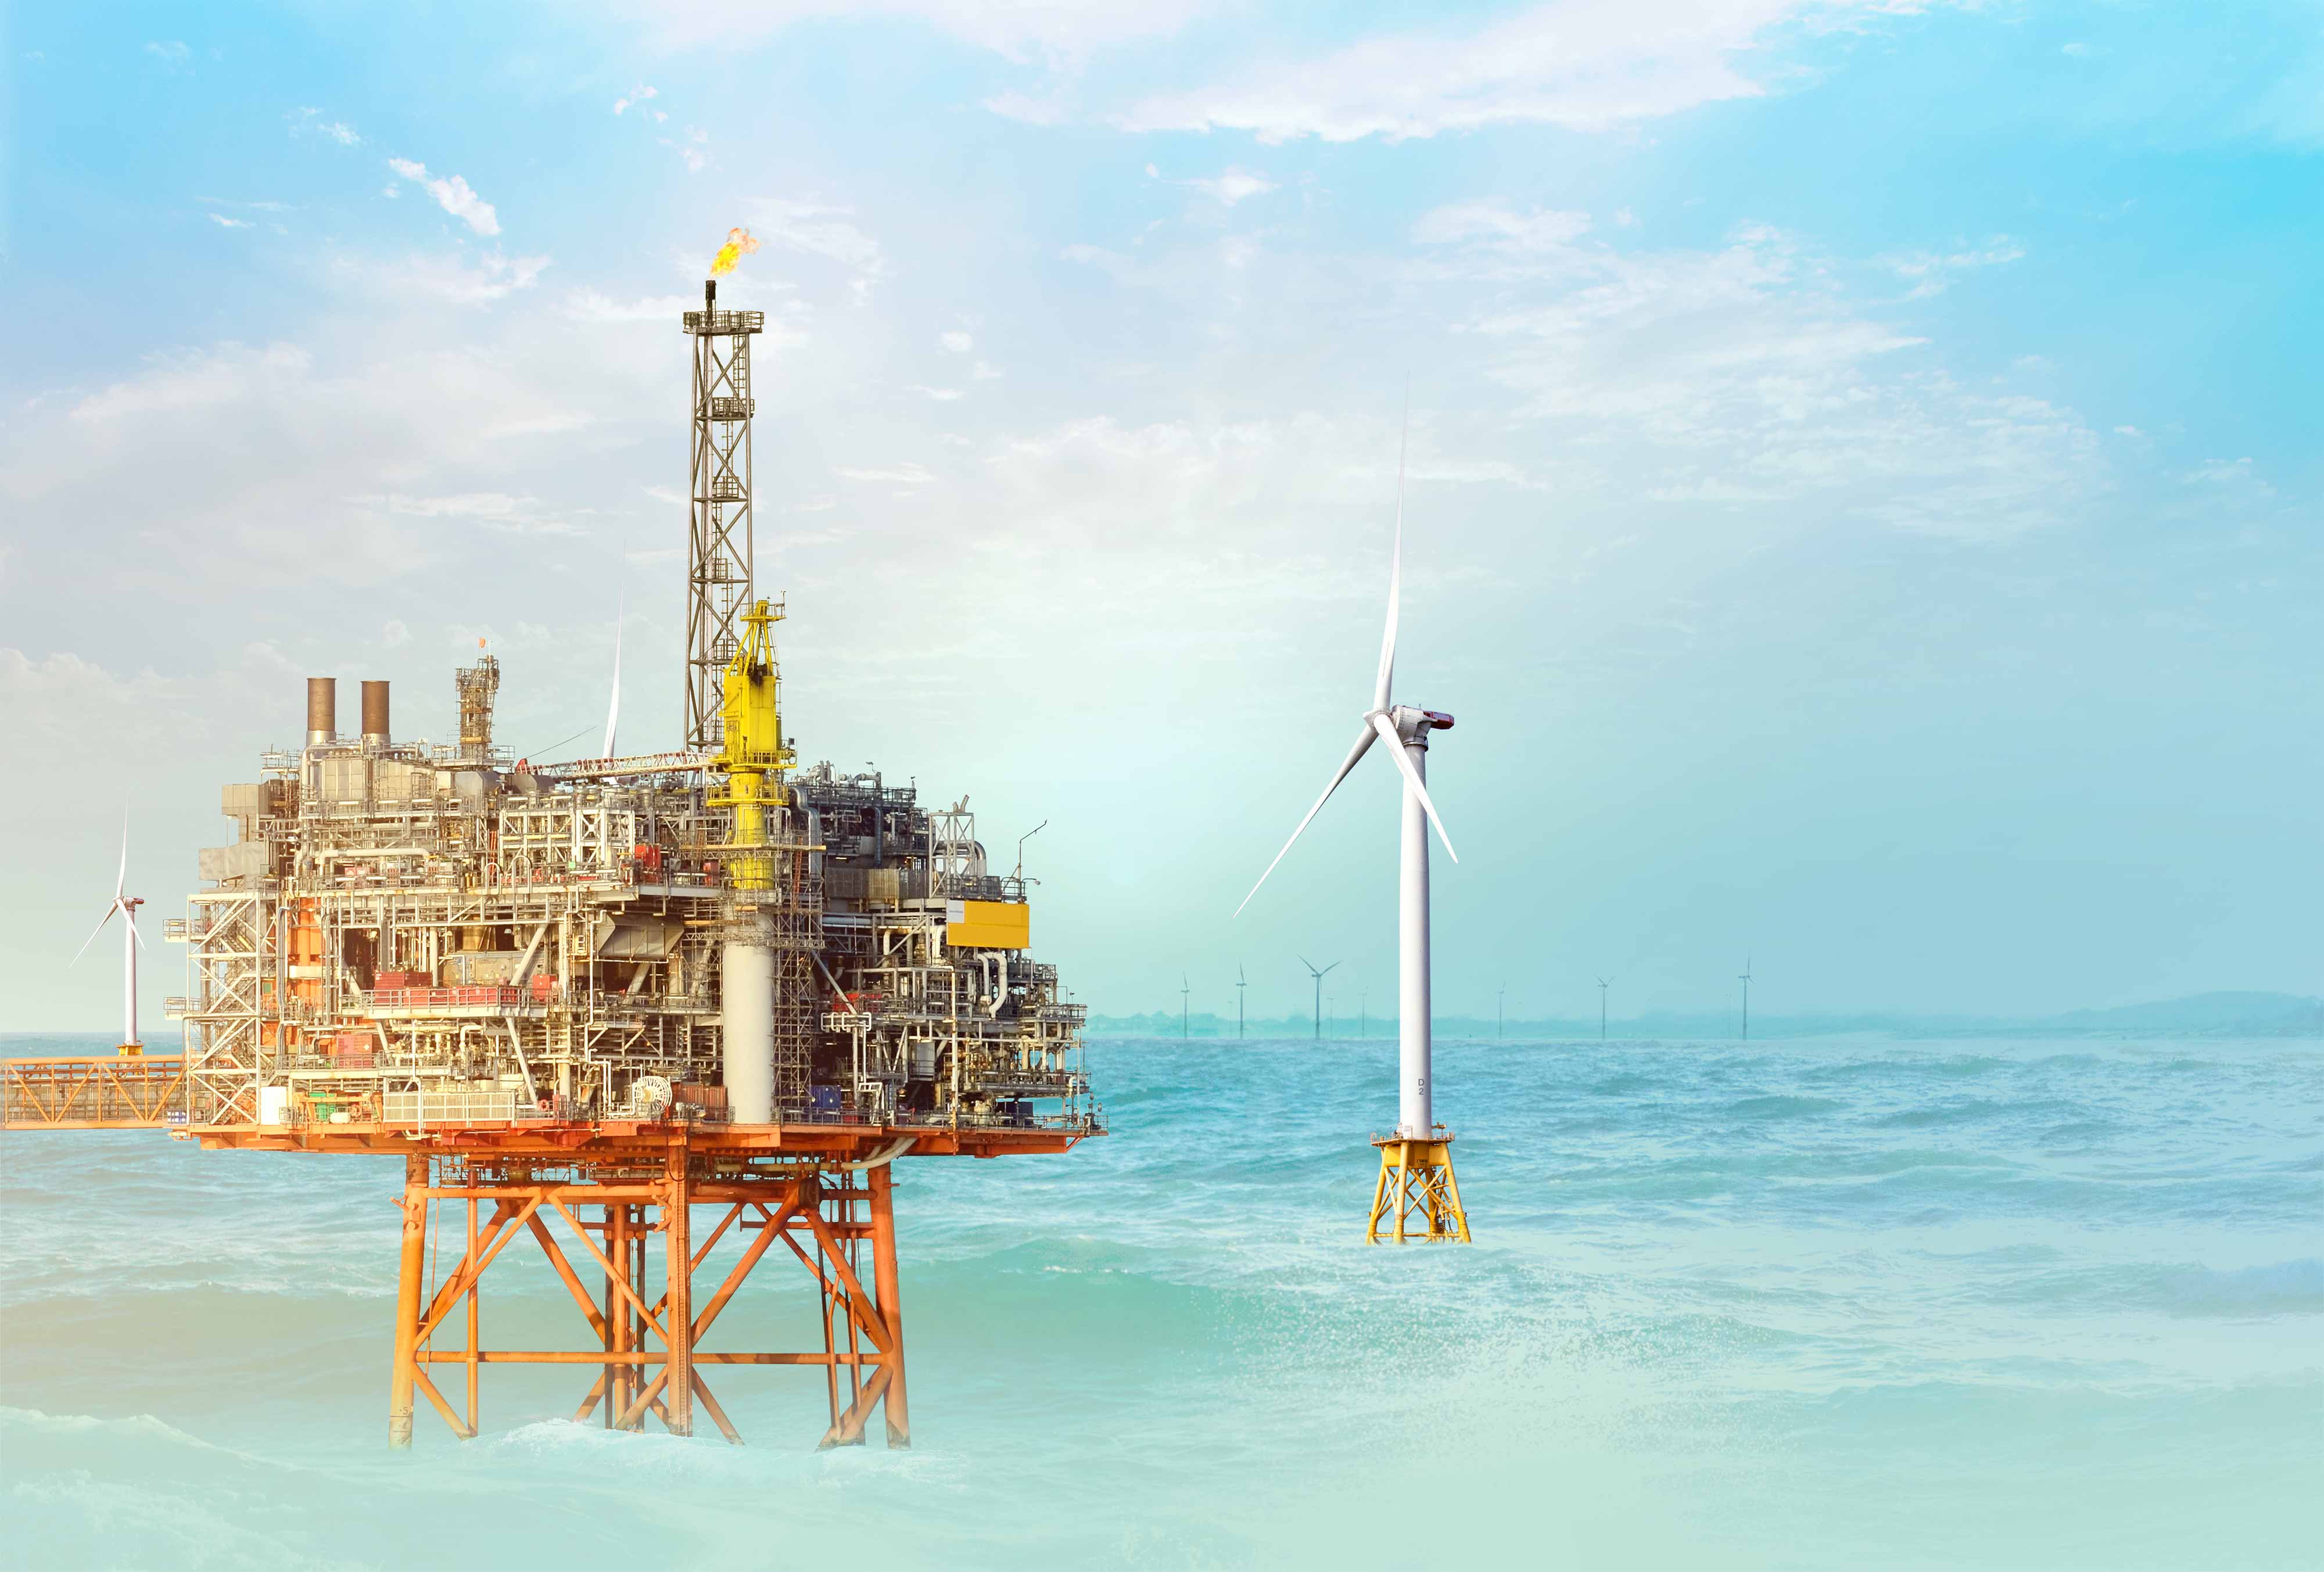
72: The percentage of coastal residents surveyed who said they would support windmills for energy off the coast, as long as they aren’t visible from shore.52: Percentage who would support visible windmills.
22: Percentage who support offshore drilling for oil and gas.

26: Percentage of respondents who support oil and gas drilling off the Atlantic coast.40: Percentage of respondents who oppose it.
Sources: A written statement from U.S. Senators Robert Menendez (D-NJ) and Frank Lautenberg (D-NJ), April 2010; National Oceanic and Atmospheric Administration; The Economist; The New York Times; Mid-Atlantic Coastal Policy: The Public View: A Survey of Residents in the Six-State Mid-Atlantic Region; Life on the Mid-Atlantic Coast 2017: A Five-State Survey of Coastal Community Residents