
West Long Branch, NJ – President Joe Biden’s big spending plans on infrastructure, support programs, and climate change remain broadly popular even though he personally does not. The latest Monmouth (“Mon-muth”) University Poll finds that many Americans feel that Biden has been unable to deliver on his promise to get Washington working and there has been an uptick in views that he is not helping either the middle class or the poor. Republicans and independents are more likely to blame the progressive wing of the Democratic Party in Congress for the foot-dragging on the Build Back Better plan. Among Democrats in the general public, though, which wing of the party is at fault depends on where on the ideological spectrum one sits. The poll also finds vast differences in public opinion on messaging around race curriculum depending on how the issue is framed.
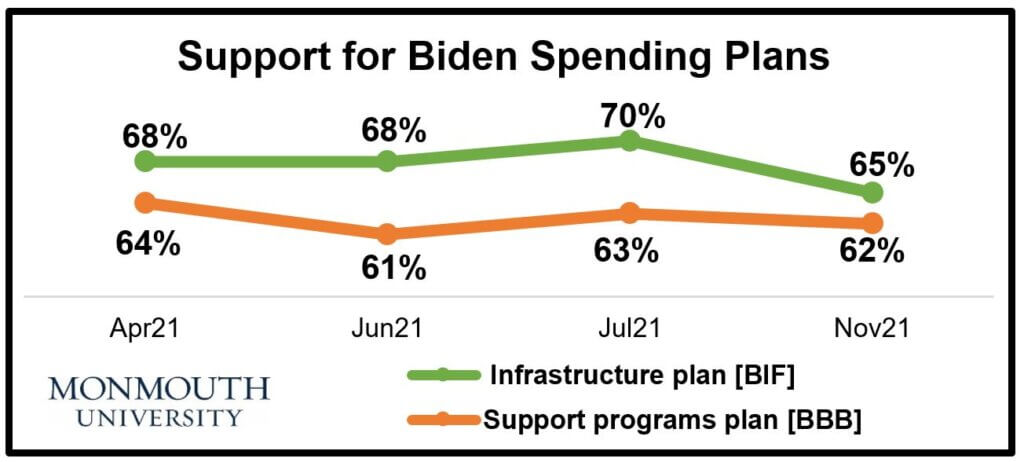
The president’s large spending plans remain broadly popular. Support for the Bipartisan Infrastructure deal (BIF), which passed Congress last week and awaits the president’s signature, stands at 65%, down just a few points from prior polls. Support for the still-pending Build Back Better (BBB) plan to expand access to health care, college, paid leave and other services remains steady at 62%. Furthermore, 60% of Americans support the climate change funding part of the BBB bill. Partisan support for each of these three spending elements stands at 94%-96% among Democrats and at 60%-61% among independents. Republican support declines from 37% for the BIF, to 26% for BBB support programs and 19% for the climate change portion of BBB.
The public is divided on whether significant reductions made to the BBB plan’s size during negotiations between Congressional Democrats and the Biden administration are a good thing (42%) or bad thing (46%). Most Republicans (62%) see these cuts as good and most Democrats (64%) see them as bad. If the BBB bill does not get enacted because of a lack of agreement among Congressional Democrats, more Americans would blame the progressive wing (40%) of the party than the moderate wing (33%). In the eyes of Democrats in the general public, though, the responsibility would rest on the shoulders of moderates (50%) more than progressives (30%). However, this result masks a division among Democrats based on political ideology. Self-described liberal Democrats would place more blame on Congressional moderates (66%, to 17% who would blame the progressives more) if the bill failed. Moderate to conservative Democrats would actually find more fault with the progressive wing (49%, to 29% who would blame the moderate wing). In the poll sample, Democratic identifiers and leaners are almost evenly divided between describing themselves as liberal (53%) or moderate to conservative (47%).
“The Democratic Party may have a big tent, but right now it’s hosting a wedding between the Hatfields and McCoys. Each side insists on staying on their own turf and blames the other one for not taking to the dance floor. This seems to be as true at the grass roots level as it is in the U.S. Capitol. The irony is that progressives and moderates pretty much agree on the policy objectives in the president’s plan. They just don’t know how to talk to each other in order to get the win,” said Patrick Murray, director of the independent Monmouth University Polling Institute.
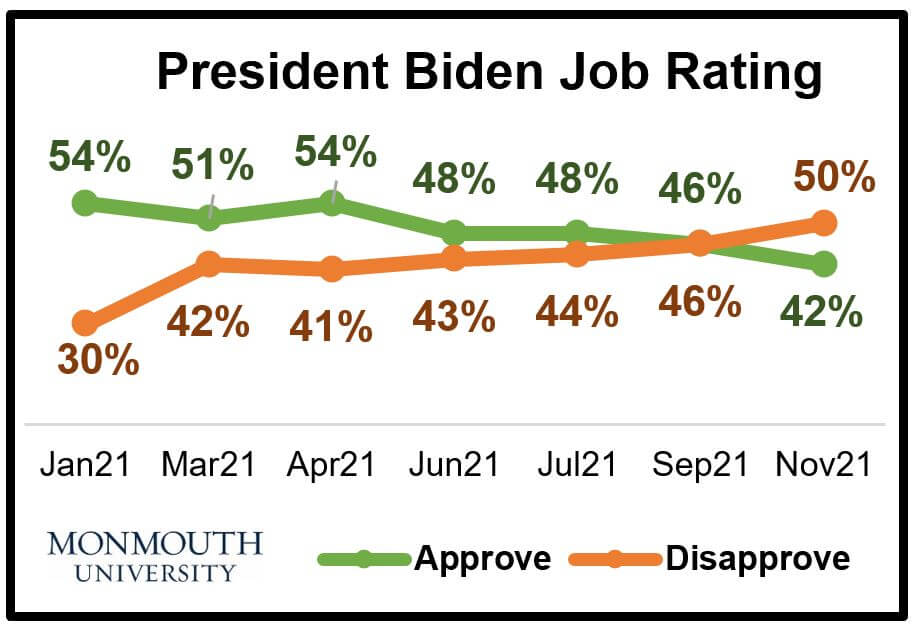
Biden currently holds a job performance rating of 42% approve and 50% disapprove. This marks another decline in his approval number since he hit 54% in April, before dropping to 48% in June and 46% in September. Six in ten (62%) Americans say that Biden has not been able to deliver on his promise to get Washington working and about half (51%) say that his policy proposals are veering too far to the left. When asked which is the president’s bigger problem, 36% say it is his inability to get Washington working and 29% say it is a swing to the left, while 19% say neither are a problem and 10% volunteer that both are equally problematic. Republicans see Biden’s seeming leftward swing (62%) as more problematic than his not getting Washington to work (13%), but independents are more likely to point to capability (42%) than ideology (26%) as Biden’s bigger problem. Among Democrats, 49% say his inability to get Washington in gear is the bigger problem and just 6% say it is policies that lean too far to the left, although 36% see neither as a concern for Biden. This opinion holds among both liberal Democrats and moderate to conservative Democrats.
“These results raise the question of whether Biden’s policies are too far to the left for the American public or whether his inability to wrap things up over the summer has given Republicans an opening. The White House and Congressional Democrats lack a cohesive and concrete message about how this bill will help the American public which creates a void in the public debate,” said Murray. He added, “Biden’s appeal as an everyman who will help the middle class and the economically disadvantaged has taken a hit on both fronts in the past few months.”
When asked about the impact of Biden’s policies on different economic groups, 42% say that middle-class families have not benefited at all so far (up from 33% in July), 36% say that poor families have not benefitted at all (up from 29%), and 32% say that wealthy families have not benefited at all (down from 35%). In terms of the middle class, Biden is doing worse than former President Donald Trump did on this metric (32%-36% not at all benefit) after signing his tax cut deal at the end of 2017.
The poll finds that more than two-thirds of the American public say both the Democratic Party (69%) and the Republican Party (69%) do not pay enough attention to everyday economic issues that affect people like them. While it is no surprise that nearly 9 in 10 partisans say this about the opposite party, it is worth noting that more than 4 in 10 Democrats (44%) and Republicans (45%) alike feel that their own party does not give enough attention to their pocketbook concerns.
“This is one of the reasons we are seeing more frequent turnover in political control. The party in power has to deliver. If it doesn’t, enough voters will opt for the other party by default. But in the absence of real trust in either party’s economic policies, the political debate winds up being about memes more than substance,” said Murray.
As a test of message framing, the Monmouth University Poll asked two different questions about teaching race in public schools – something that has become a national hot button issue and figured into this year’s Virginia governor’s race. Among the one half of the poll sample that was asked about teaching “the history of racism” in public schools, 75% approved – including majorities of Democrats (94%), independents (75%), and Republicans (54%). The other half of the sample that was asked about teaching “critical race theory” in public schools produced only 43% support overall – ranging from 75% of Democrats to 40% of independents and 16% of Republicans.
“The public acts on its perceptions of the world around them. Sometimes those perceptions align with objective reality and sometimes they do not. Whoever controls the message controls how the public will react. As the huge differences in the poll questions on teaching race show, a negative visceral message can be very powerful in reframing an issue in the public’s mind. The same is true for a massive spending bill as we saw with the talk of ‘death panels’ during the ACA debate in 2010,” said Murray.
The poll also finds the public’s job performance rating for Congress stands at 18% approve and 70% disapprove. The last time Congressional approval dropped below 20% in the Monmouth University Poll was August 2019 (17%). Speaker of the House Nancy Pelosi registers a 28% approve to 49% disapprove rating, with 22% having no opinion. Polls in 2019 and 2020 showed her positive rating in the 31%-35% range and her negative rating in the 43%-45% range. Senate Majority Leader Chuck Schumer earns a 21% approve to 37% disapprove rating, with 43% having no opinion.
The percentage of Americans who say the country is headed in the right direction (31%) versus the wrong track (64%) is similar to September’s results (29% to 65%), but the right direction rating has declined after hitting an eight-year high in April (46%).
The Monmouth University Poll was conducted by telephone from November 4 to 8, 2021 with 811 adults in the United States. The question results in this release have a margin of error of +/- 3.5 percentage points. The poll was conducted by the Monmouth University Polling Institute in West Long Branch, NJ.
QUESTIONS AND RESULTS
(* Some columns may not add to 100% due to rounding.)
1.Do you approve or disapprove of the job Joe Biden is doing as president?
| TREND: | Nov. 2021 | Sept. 2021 | July 2021 | June 2021 | April 2021 | March 2021 | Jan. 2021 |
| Approve | 42% | 46% | 48% | 48% | 54% | 51% | 54% |
| Disapprove | 50% | 46% | 44% | 43% | 41% | 42% | 30% |
| (VOL) No opinion | 9% | 8% | 8% | 9% | 5% | 8% | 16% |
| (n) | (811) | (802) | (804) | (810) | (800) | (802) | (809) |
2.Do you approve or disapprove of the job the U.S. Congress is doing?
| TREND: | Nov. 2021 | Sept. 2021 | July 2021 | June 2021 | April 2021 | March 2021 | Jan. 2021 |
| Approve | 18% | 22% | 23% | 21% | 35% | 30% | 35% |
| Disapprove | 70% | 65% | 62% | 65% | 56% | 59% | 51% |
| (VOL) No opinion | 12% | 13% | 15% | 15% | 9% | 11% | 14% |
| (n) | (811) | (802) | (804) | (810) | (800) | (802) | (809) |
| TREND: Continued | Nov. 2020 | Early June 2020 | May 2020 | April 2020 | Feb. 2020 | Jan. 2020 | Dec. 2019 | Nov. 2019 | Sept. 2019 | Aug. 2019 | June 2019 | May 2019 | April 2019 | March 2019 | Jan. 2019 |
| Approve | 23% | 22% | 32% | 32% | 20% | 24% | 22% | 23% | 21% | 17% | 19% | 20% | 24% | 23% | 18% |
| Disapprove | 64% | 69% | 55% | 55% | 69% | 62% | 65% | 64% | 68% | 71% | 69% | 71% | 62% | 68% | 72% |
| (VOL) No opinion | 13% | 9% | 13% | 13% | 11% | 14% | 13% | 13% | 11% | 13% | 12% | 9% | 14% | 9% | 10% |
| (n) | (810) | (807) | (808) | (857) | (902) | (903) | (903) | (908) | (1,161) | (800) | (751) | (802) | (801) | (802) | (805) |
| TREND: Continued | Nov. 2018 | Aug. 2018 | June 2018 | April 2018 | March 2018 | Jan. 2018 | Dec. 2017 | Sept. 2017 | Aug. 2017 | July 2017 | May 2017 | March 2017 | Jan. 2017 |
| Approve | 23% | 17% | 19% | 17% | 18% | 21% | 16% | 17% | 18% | 19% | 19% | 25% | 23% |
| Disapprove | 63% | 69% | 67% | 71% | 72% | 68% | 65% | 69% | 69% | 70% | 68% | 59% | 66% |
| (VOL) No opinion | 14% | 14% | 14% | 12% | 11% | 11% | 19% | 15% | 13% | 11% | 13% | 16% | 11% |
| (n) | (802) | (805) | (806) | (803) | (803) | (806) | (806) | (1,009) | (805) | (800) | (1,002) | (801) | (801) |
| TREND: Continued | Sept. 2016* | Aug. 2016* | June 2016* | March 2016 | Jan. 2016 | Dec. 2015 | Oct. 2015 | Sept. 2015 | Aug. 2015 | July 2015 | June 2015 | April 2015 | Jan. 2015 | Dec. 2014 | July 2013 |
| Approve | 15% | 14% | 17% | 22% | 17% | 16% | 17% | 19% | 18% | 18% | 19% | 21% | 18% | 17% | 14% |
| Disapprove | 77% | 78% | 76% | 68% | 73% | 73% | 71% | 71% | 72% | 69% | 71% | 67% | 70% | 73% | 76% |
| (VOL) No opinion | 8% | 9% | 7% | 10% | 10% | 10% | 12% | 11% | 11% | 12% | 10% | 12% | 11% | 11% | 10% |
| (n) | (802) | (803) | (803) | (1,008) | (1,003) | (1,006) | (1,012) | (1,009) | (1,203) | (1,001) | (1,002) | (1,005) | (1,003) | (1,008) | (1,012) |
* Registered voters
[QUESTIONS 3 & 4 WERE ROTATED]
3.Do you approve or disapprove of the job Chuck Schumer is doing as Senate Majority Leader, or do you have no opinion of him?
| TREND: | Nov. 2021 | April 2018* | July 2017* |
| Approve | 21% | 16% | 17% |
| Disapprove | 37% | 29% | 28% |
| No opinion | 43% | 55% | 55% |
| (n) | (811) | (803) | (800) |
*Question wording was: “as Senate Minority Leader?”
4.Do you approve or disapprove of the job Nancy Pelosi is doing as Speaker of the House, or do you have no opinion of her?
| TREND: | Nov. 2021 | Jan. 2020 | Nov. 2019 | Jan. 2019 | Nov. 2018* | April 2018* | July 2017* |
| Approve | 28% | 35% | 31% | 34% | 17% | 17% | 17% |
| Disapprove | 49% | 43% | 45% | 45% | 38% | 44% | 42% |
| No opinion | 22% | 22% | 24% | 21% | 45% | 39% | 41% |
| (n) | (811) | (903) | (908) | (805) | (802) | (803) | (800) |
*Question wording was: “as House Minority Leader?”
5.Would you say things in the country are going in the right direction, or have they gotten off on the wrong track?
| TREND: | Nov. 2021 | Sept. 2021 | July 2021 | June 2021 | April 2021 | March 2021 | Jan. 2021 |
| Right direction | 31% | 29% | 38% | 37% | 46% | 34% | 42% |
| Wrong track | 64% | 65% | 56% | 57% | 50% | 61% | 51% |
| (VOL) Depends | 2% | 4% | 3% | 3% | 2% | 4% | 3% |
| (VOL) Don’t know | 3% | 2% | 4% | 3% | 2% | 2% | 4% |
| (n) | (811) | (802) | (804) | (810) | (800) | (802) | (809) |
| TREND: Continued | Nov. 2020 | Early Sept. 2020 | Aug. 2020 | Late June 2020 | Early June 2020 | May 2020 | April 2020 | March 2020 | Feb. 2020 | Jan. 2020 |
| Right direction | 26% | 27% | 22% | 18% | 21% | 33% | 30% | 39% | 37% | 37% |
| Wrong track | 68% | 66% | 72% | 74% | 74% | 60% | 61% | 54% | 57% | 56% |
| (VOL) Depends | 4% | 4% | 4% | 5% | 4% | 4% | 5% | 4% | 6% | 6% |
| (VOL) Don’t know | 2% | 3% | 2% | 3% | 1% | 3% | 5% | 3% | 1% | 1% |
| (n) | (810) | (867) | (868) | (867) | (807) | (808) | (857) | (851) | (902) | (903) |
| TREND: Continued | Dec. 2019 | Nov. 2019 | Sept. 2019 | Aug. 2019 | June 2019 | May 2019 | April 2019 | March 2019 | Nov. 2018 | Aug. 2018 | June 2018 | April 2018 | March 2018 | Jan. 2018 |
| Right direction | 32% | 30% | 30% | 28% | 31% | 29% | 28% | 29% | 35% | 35% | 40% | 33% | 31% | 37% |
| Wrong track | 56% | 61% | 61% | 62% | 62% | 63% | 62% | 63% | 55% | 57% | 53% | 58% | 61% | 57% |
| (VOL) Depends | 8% | 7% | 6% | 8% | 6% | 4% | 7% | 6% | 7% | 6% | 3% | 5% | 6% | 3% |
| (VOL) Don’t know | 4% | 2% | 2% | 2% | 2% | 3% | 3% | 2% | 3% | 3% | 3% | 4% | 1% | 3% |
| (n) | (903) | (908) | (1,161) | (800) | (751) | (802) | (801) | (802) | (802) | (805) | (806) | (803) | (803) | (806) |
| TREND: Continued | Dec. 2017 | Aug. 2017 | May 2017 | March 2017 | Jan. 2017 | Aug. 2016* | Oct. 2015 | July 2015 | June 2015 | April 2015 | Dec. 2014 | July 2013 |
| Right direction | 24% | 32% | 31% | 35% | 29% | 30% | 24% | 28% | 23% | 27% | 23% | 28% |
| Wrong track | 66% | 58% | 61% | 56% | 65% | 65% | 66% | 63% | 68% | 66% | 69% | 63% |
| (VOL) Depends | 7% | 4% | 5% | 4% | 4% | 2% | 6% | 5% | 5% | 5% | 5% | 5% |
| (VOL) Don’t know | 3% | 5% | 3% | 5% | 2% | 3% | 4% | 3% | 3% | 2% | 3% | 4% |
| (n) | (806) | (805) | (1,002) | (801) | (801) | (803) | (1,012) | (1,001) | (1,002) | (1,005) | (1,008) | (1,012) |
* Registered voters
6.How much have each of the following groups benefited from President Biden’s policies so far. [READ ITEM] – Have they benefited a lot, a little, or not at all? [ITEMS WERE ROTATED]
Middle class families
| COMPARISON: | Benefited under Trump | Benefited under Obama | |||||||||||
| Nov. 2021 | July 2021 | June 2021 | Jan. 2021 | April 2019 | April 2018 | Dec. 2017 | Jan. 2017 | July 2013 | |||||
| A lot | 14% | 21% | 19% | 32% | 18% | 14% | 11% | 24% | 12% | ||||
| A little | 39% | 41% | 32% | 33% | 37% | 45% | 25% | 41% | 39% | ||||
| Not at all | 42% | 33% | 36% | 32% | 36% | 36% | 53% | 33% | 46% | ||||
| (VOL) Don’t know | 5% | 5% | 14% | 3% | 9% | 5% | 11% | 2% | 2% | ||||
| (n) | (811) | (804) | (810) | (809) | (801) | (803) | (806) | (801) | (1,012) | ||||
Wealthy families
| COMPARISON: | Benefited under Trump | Benefited under Obama | ||||||||
| Nov. 2021 | July 2021 | April 2019 | April 2018 | Jan. 2017 | July 2013 | |||||
| A lot | 25% | 22% | 58% | 57% | 29% | 35% | ||||
| A little | 28% | 30% | 22% | 26% | 43% | 31% | ||||
| Not at all | 32% | 35% | 9% | 7% | 17% | 23% | ||||
| (VOL) Don’t know | 14% | 14% | 11% | 10% | 10% | 10% | ||||
| (n) | (811) | (804) | (801) | (803) | (801) | (1,012) | ||||
Poor families
| COMPARISON: | Benefited under Trump | Benefited under Obama | ||||||||
| Nov. 2021 | July 2021 | April 2019 | April 2018 | Jan. 2017 | July 2013 | |||||
| A lot | 22% | 31% | 14% | 12% | 39% | 20% | ||||
| A little | 38% | 35% | 26% | 28% | 36% | 39% | ||||
| Not at all | 36% | 29% | 51% | 53% | 21% | 37% | ||||
| (VOL) Don’t know | 4% | 5% | 9% | 7% | 4% | 4% | ||||
| (n) | (811) | (804) | (801) | (803) | (801) | (1,012) | ||||
[QUESTIONS 7 & 8 WERE ROTATED]
7.Does the Republican Party pay too much, the right amount, or not enough attention to everyday economic issues that affect people like you?
| TREND: | Nov. 2021 | Nov. 2018 | March 2017 |
| Too much | 4% | 3% | 4% |
| Right amount | 23% | 30% | 28% |
| Not enough | 69% | 63% | 63% |
| (VOL) Don’t know | 5% | 4% | 4% |
| (n) | (811) | (802) | (801) |
8.Does the Democratic Party pay too much, the right amount, or not enough attention to everyday economic issues that affect people like you?
| TREND: | Nov. 2021 | Nov. 2018 | March 2017 |
| Too much | 4% | 4% | 5% |
| Right amount | 25% | 26% | 25% |
| Not enough | 69% | 64% | 65% |
| (VOL) Don’t know | 3% | 6% | 5% |
| (n) | (811) | (802) | (801) |
[QUESTIONS 9 & 10 WERE ROTATED]
President Biden proposed a couple of multi-trillion dollar spending plans earlier this year.
9.[One is/The other is] an infrastructure plan to be spent on roads, bridges and trains, internet access, power grid improvements, and clean energy projects. In general, do you support or oppose this plan? [Is that strongly or somewhat (support/oppose)?]
| TREND: | Nov. 2021 | July 2021 | June 2021 | April 2021* | |
| Strongly support | 44% | 51% | 49% | Support | 68% |
| Somewhat support | 21% | 19% | 19% | ||
| Somewhat oppose | 8% | 8% | 8% | Oppose | 29% |
| Strongly oppose | 23% | 21% | 21% | ||
| (VOL) Don’t know | 3% | 2% | 3% | (VOL) Don’t know | 3% |
| (n) | (811) | (804) | (810) | (n) | (800) |
* April 2021 wording was “President Biden recently proposed a $2 trillion infrastructure plan…”
10.[One is/The other is] a plan to expand access to healthcare and childcare, and provide paid leave and college tuition support. In general, do you support or oppose this plan? [Is that strongly or somewhat (support/oppose)?]
| TREND: | Nov. 2021 | July 2021 | June 2021 | April 2021* | |
| Strongly support | 45% | 47% | 41% | Support | 64% |
| Somewhat support | 17% | 16% | 20% | ||
| Somewhat oppose | 7% | 8% | 10% | Oppose | 34% |
| Strongly oppose | 28% | 27% | 24% | ||
| (VOL) Don’t know | 4% | 2% | 5% | (VOL) Don’t know | 2% |
| (n) | (811) | (804) | (810) | (n) | (800) |
* April 2021 wording was “Biden is also expected to propose a large spending plan …”
11.The plan to expand healthcare and other forms of support also includes a significant amount of money to deal with climate change. In general, do you support or oppose the climate change part of the plan? [Is that strongly or somewhat (support/oppose)?]
| Nov. 2021 | |
| Strongly support | 47% |
| Somewhat support | 13% |
| Somewhat oppose | 7% |
| Strongly oppose | 31% |
| (VOL) Don’t know | 3% |
| (n) | (811) |
12.The part of the bill that expands support programs has been significantly reduced in size during negotiations between Congressional Democrats and the Biden administration. Do you see that reduction as a good thing or bad thing overall?
| Nov. 2021 | |
| Good | 42% |
| Bad | 46% |
| (VOL) Don’t know | 12% |
| (n) | (811) |
13.Passage of the reduced bill on support programs and climate change has been delayed because members of the progressive and the moderate wings of the Democratic Party have not been able to reach a final agreement. If this bill does NOT get enacted, who would you see as being more responsible for its failure – the progressives or the moderates in the Democratic Party?
| Nov. 2021 | |
| Progressives | 40% |
| Moderates | 33% |
| (VOL) Both equally | 9% |
| (VOL) Don’t know | 18% |
| (n) | (811) |
[QUESTIONS 14 & 15 WERE ROTATED]
14.Do you agree or disagree that Joe Biden’s policy proposals are veering too far to the left?
| Nov. 2021 | |
| Agree | 51% |
| Disagree | 45% |
| (VOL) Don’t know | 5% |
| (n) | (811) |
15.Do you agree or disagree that Joe Biden has not been able to deliver on his promise to get Washington working?
| Nov. 2021 | |
| Agree | 62% |
| Disagree | 31% |
| (VOL) Don’t know | 7% |
| (n) | (811) |
16.If you had to choose between the two, do you feel the bigger problem for Joe Biden is that his policy proposals are veering too far to the left or that he has not been able to get Washington working, or have neither been a problem for Biden?
| Nov. 2021 | |
| Veering too far to the left | 29% |
| Not able to get Washington working | 36% |
| Neither | 19% |
| (VOL) Both equally | 10% |
| (VOL) Don’t know | 6% |
| (n) | (811) |
[Q17-23 held for future release.]
[NOTE: Question 24 was asked in alternate forms to separate random half samples; Q24A n=407, m.o.e.= +/- 4.9% and Q24B n=404, m.o.e.= +/- 4.9%]
24A.Do you approve or disapprove of public schools teaching about the history of racism? [Do you approve/disapprove strongly or somewhat?]
| Nov. 2021 | |
| Strongly approve | 57% |
| Somewhat approve | 18% |
| Somewhat disapprove | 5% |
| Strongly disapprove | 16% |
| (VOL) Don’t know | 4% |
| (n) | (407) |
24B.Do you approve or disapprove of public schools teaching about critical race theory? [Do you approve/disapprove strongly or somewhat?]
| Nov. 2021 | |
| Strongly approve | 30% |
| Somewhat approve | 13% |
| Somewhat disapprove | 8% |
| Strongly disapprove | 38% |
| (VOL) Don’t know | 11% |
| (n) | (404) |
[Q25-44 held for future release.]
METHODOLOGY
The Monmouth University Poll was sponsored and conducted by the Monmouth University Polling Institute from November 4 to 8, 2021 with a national random sample of 811 adults age 18 and older. This includes 283 contacted by a live interviewer on a landline telephone and 528 contacted by a live interviewer on a cell phone, in English. Telephone numbers were selected through a mix of random digit dialing and list-based sampling. Landline respondents were selected with a modified Troldahl-Carter youngest adult household screen. Monmouth is responsible for all aspects of the survey design, data weighting and analysis. The full sample is weighted for region, age, education, gender and race based on US Census information (ACS 2018 one-year survey). Data collection support provided by Braun Research (field), Dynata (RDD sample), and Aristotle (list sample). For results based on this sample, one can say with 95% confidence that the error attributable to sampling has a maximum margin of plus or minus 3.5 percentage points (unadjusted for sample design). Sampling error can be larger for sub-groups (see table below). In addition to sampling error, one should bear in mind that question wording and practical difficulties in conducting surveys can introduce error or bias into the findings of opinion polls.
| DEMOGRAPHICS (weighted) |
| Self-Reported |
| 27% Republican |
| 43% Independent |
| 31% Democrat |
| 49% Male |
| 51% Female |
| 30% 18-34 |
| 32% 35-54 |
| 38% 55+ |
| 63% White |
| 12% Black |
| 16% Hispanic |
| 8% Asian/Other |
| 69% No degree |
| 31% 4 year degree |
Click on pdf file link below for full methodology and crosstabs by key demographic groups.