
West Long Branch, NJ – A majority of Americans support the vaccine mandates announced by President Joe Biden last week amid rising concerns about the chance of catching Covid. According to the Monmouth (“Mon-muth”) University Poll, the public also supports instituting guidelines for masking and social distancing in their state as well as requiring people to show proof of vaccination for certain activities, such as boarding an airplane or going to the office. The poll finds majority support for nearly all these measures in both blue states and red states, although a significant number of people – mostly Republicans – remain opposed to getting the Covid vaccine.
Support for instituting, or reinstituting, state-based face mask and social distancing guidelines has increased in the past few months. Currently, 63% support these measures in their state, which is up from 52% in July. This shift has come mostly in blue states, which were experiencing a lull in Covid transmission early in the summer. In Monmouth’s July poll, residents of states that voted for President Joe Biden (49%) were slightly less likely than those in states that voted for former President Donald Trump (54%) to support instituting these guidelines. Now, 66% (+17 points) of blue state residents and 59% (+5 points) of red state residents support these measures. Majority support in both types of states comes even though only 32% of Republicans individually support these measures.
The poll also finds that 66% of Americans support requiring that face masks be worn by students, teachers, and staff in schools. This includes majorities of blue state (68%) and red state (63%) residents.
“The current poll shows majorities of residents in both red states and blue states support some type of Covid control measures, and that includes many of the mandates proposed by the president last week,” said Patrick Murray, director of the independent Monmouth University Polling Institute.
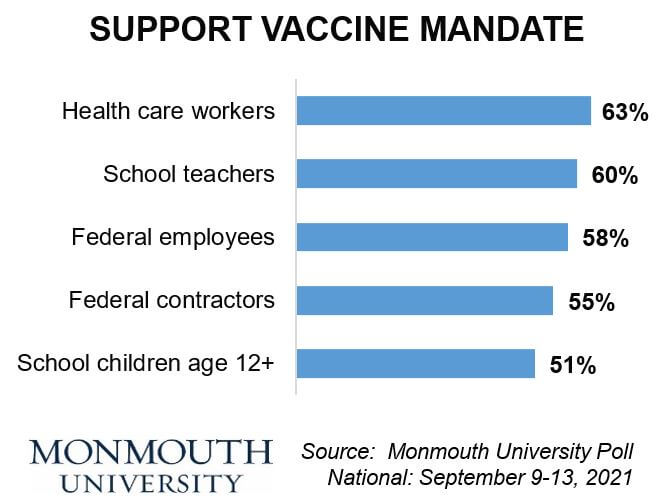
Most Americans support vaccine mandates for key groups mentioned in Biden’s announcement last week. This includes requiring Covid vaccines for health care workers (63%), federal employees (58%), and private contractors working for the federal government (55%). The poll also finds majority support (60%) for requiring teachers and school staff to be vaccinated. Half (51%) of the American public supports a vaccine mandate for school students aged 12 and older. The blue state/red state difference in support for any of these mandates is no larger than 5 points (e.g. 65% blue state and 60% red state for health care workers). Both types of states show majority support for all of these mandates except in the case of school children (53% in blue states, but just 48% in red states).
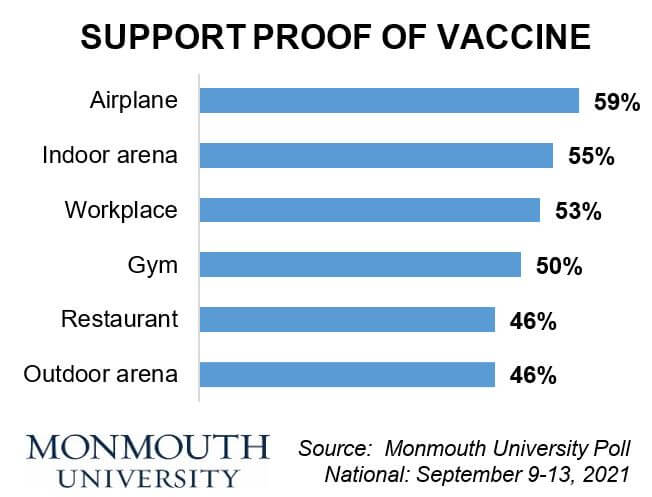
The poll also finds that a majority of Americans (59%) support requiring people to show proof of Covid vaccination in order to fly on a plane. Smaller majorities support the same requirement for going to an indoor arena for a sporting event or concert (55%) and going to an office or work setting around other people (53%). There is slightly less support for requiring vaccine proof to go to a gym (50%), dine inside a restaurant (46%), or attend an event at an outdoor arena (46%). The blue state and red state support numbers for providing proof of vaccination differ by no more than 2 points in any of these cases. Nearly all unvaccinated Americans oppose having to show Covid vaccine proof to enter any of these venues, and they are joined by a minority of those who have been vaccinated themselves. This ranges from 24% of vaccinated people who oppose having to show vaccine proof to fly on a plane to 39% who oppose having to show proof to go to an outdoor arena.
“The delta variant has dampened public confidence that we will get clear of this pandemic. That’s probably playing a role in broad support for mandates and other measures,” said Murray.
Just 11% of the public believes that the country will get the outbreak under control by the end of the year. This marks a steep decline in optimism since March, when 61% felt that things would start returning to normal by year’s end. At the other end of the spectrum, 22% of Americans feel that we will never get Covid under control and return to normal. Just 9% felt this way six months ago.
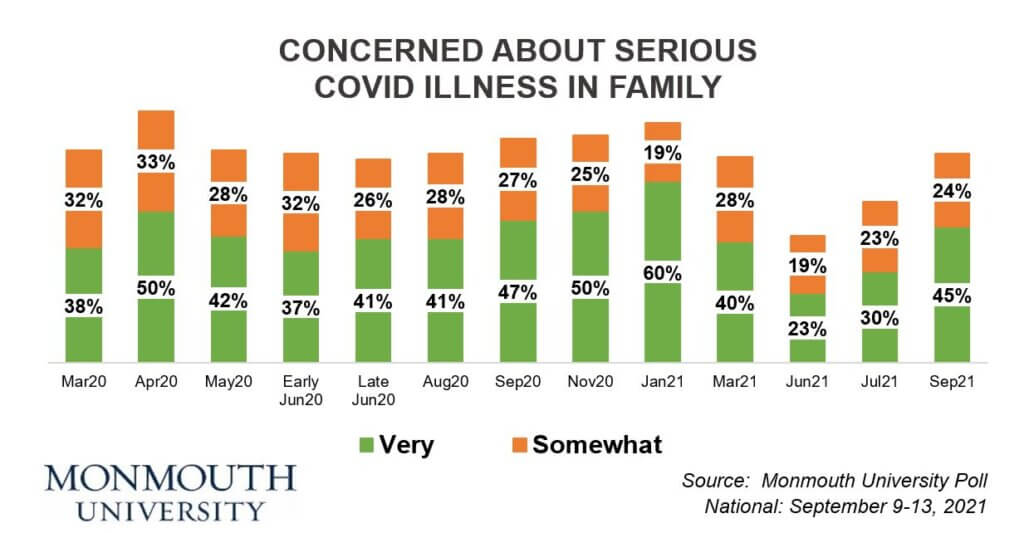
Just under half (45%) of American adults are very concerned about a family member becoming seriously ill from the coronavirus. This number has been on the rise since hitting a pandemic-era low of 23% in June. The high point for this metric was 60% in January. The current result approaches the level measured last September (47% very concerned). Among those who have received or are about to receive the Covid vaccine, 52% are very concerned, but just 21% of those who are waiting or are opposed to getting the vaccine feel the same level of concern about serious illness in their family.
Currently, 75% of those polled report receiving at least one dose of Covid vaccine and 2% say they will get it as soon as possible. A majority of American adults (51%) say they are very likely to get a Covid booster shot if it is made available and another 16% are somewhat likely.
The poll continues to find a sizable amount of anti-vax sentiment. This includes 6% of the public who say they are still waiting to see how it goes before getting an initial Covid shot, 15% who will not get the vaccine at all if they can avoid it, and 2% who give no answer on their vaccination intent. In prior polls, there were clear demographic differences between the wait-and-see group and the opposed group. Now that both groups have shrunk in size, they are looking much more similar in terms of their opposition to most pandemic containment measures. Among the nearly 1 in 4 who show anti-vaccine attitudes, 72% describe themselves as Republicans or lean toward the Republican Party.
“In prior polls we made a distinction between those who are vaccine-hesitant and those who are opposed. These results suggest that distinction has largely vanished and about a quarter of the adult population remains unlikely to get the vaccine without some sort of mandate,” said Murray. He added, “I think it’s possible some of the anti-vax people we poll do not answer the intent question honestly because more and more Americans disapprove of their stance as the pandemic continues to rage.”
Just 23% of those polled say the American public is doing a good job dealing with the coronavirus outbreak while 65% say it is doing a bad job. This is the most negative rating Monmouth poll participants have given to their fellow Americans since the pandemic started in March 2020. The prior low point was in August 2020 (26% good job) while the high point was in May 2020 (51% good job).
In other findings, a majority of Americans continue to give President Biden positive reviews for his handling of the pandemic, but that number has declined to 52%, from 55% in July and a high of 62% in April. Currently, 43% say Biden is doing a bad job on Covid.
“Biden’s handling of the pandemic was a strength during his first months in office. Public sentiment is not quite so rosy now, but most back his recent moves. We’ll see if the results bring about an improvement in his ratings,” said Murray.
Health agencies in the federal government generally receive positive ratings, although that sentiment is weaker than a couple of months ago. Currently, 52% say federal health agencies have done a good job, which is down from 57% in July. This number has ranged from 46% (August 2020) to 66% (April 2020). At the same time, most Americans (61%) say these agencies, such as the CDC, have been giving mixed messages about Covid risks, while just 36% say these agencies have been largely consistent in their messaging – a result which is nearly identical to two months ago.
The public continues to give positive marks for how their state governors have handled Covid – 56% say they have done a good job, which is comparable to polls in July (54%) and June (58%). More than half of residents in states that Biden won (58%) as well as states that Trump won (53%) say their governor has done a good job dealing with the pandemic.
The Monmouth University Poll was conducted by telephone from September 9 to 13, 2021 with 802 adults in the United States. The question results in this release have a margin of error of +/- 3.5 percentage points. The poll was conducted by the Monmouth University Polling Institute in West Long Branch, NJ.
QUESTIONS AND RESULTS
(* Some columns may not add to 100% due to rounding.)
[Q1-25 held for future release.]
26.How concerned are you about someone in your family becoming seriously ill from the coronavirus outbreak – very concerned, somewhat concerned, not too concerned, or not at all concerned?
| TREND: | Sept. 2021 | July 2021 | June 2021 | March 2021 | Jan. 2021 | Nov. 2020 | Early Sept. 2020 | Aug. 2020 | Late June 2020 | Early June 2020 | May 2020 | April 2020 | March 2020 |
| Very concerned | 45% | 30% | 23% | 40% | 60% | 50% | 47% | 41% | 41% | 37% | 42% | 50% | 38% |
| Somewhat concerned | 24% | 23% | 19% | 28% | 19% | 25% | 27% | 28% | 26% | 32% | 28% | 33% | 32% |
| Not too concerned | 17% | 21% | 24% | 14% | 12% | 13% | 13% | 18% | 17% | 14% | 14% | 9% | 18% |
| Not at all concerned | 12% | 24% | 32% | 16% | 7% | 10% | 12% | 13% | 15% | 16% | 16% | 7% | 12% |
| (VOL) Don’t know | 1% | 0% | 1% | 0% | 0% | 0% | 0% | 0% | 0% | 0% | 0% | 0% | 0% |
| (VOL) Has already happened | 1% | 2% | 1% | 2% | 2% | 1% | 0% | 1% | 1% | 0% | 0% | 0% | n/a |
| (n) | (802) | (804) | (810) | (802) | (809) | (810) | (867) | (868) | (867) | (807) | (808) | (857) | (851) |
27.Please tell me if each of the following has done a good job or bad job dealing with the coronavirus outbreak. [ITEMS WERE ROTATED]
| TREND: | Good Job | Bad Job | (VOL) Mixed, depends | (VOL) Don’t know | (n) |
| President Biden | 52% | 43% | 4% | 1% | (802) |
| — July 2021 | 55% | 38% | 4% | 3% | (804) |
| — June 2021 | 59% | 32% | 4% | 5% | (810) |
| — April 2021 | 62% | 31% | 3% | 3% | (800) |
| — March 2021 | 57% | 31% | 3% | 8% | (802) |
| — January 2021 | 58% | 23% | 5% | 15% | (809) |
| Your state’s governor | 56% | 38% | 3% | 3% | (802) |
| — July 2021 | 54% | 42% | 3% | 2% | (804) |
| — June 2021 | 58% | 33% | 5% | 4% | (810) |
| — April 2021 | 62% | 34% | 3% | 2% | (800) |
| — March 2021 | 56% | 38% | 3% | 2% | (802) |
| — January 2021 | 57% | 38% | 3% | 2% | (809) |
| — Early September 2020 | 61% | 35% | 3% | 1% | (867) |
| — August 2020 | 57% | 35% | 5% | 3% | (868) |
| — Late June 2020 | 65% | 28% | 5% | 2% | (867) |
| — Early June 2020 | 67% | 28% | 3% | 1% | (807) |
| — May 2020 | 73% | 22% | 3% | 2% | (808) |
| — April 2020 | 72% | 21% | 4% | 3% | (857) |
| — March 2020 | 72% | 18% | 4% | 6% | (851) |
| The American public | 23% | 65% | 10% | 2% | (802) |
| — July 2021 | 32% | 51% | 12% | 5% | (804) |
| — June 2021 | 42% | 40% | 14% | 4% | (810) |
| — April 2021 | 43% | 44% | 10% | 4% | (800) |
| — March 2021 | 35% | 53% | 11% | 1% | (802) |
| — January 2021 | 32% | 60% | 6% | 2% | (809) |
| — Early September 2020 | 31% | 57% | 10% | 2% | (867) |
| — August 2020 | 26% | 62% | 11% | 1% | (868) |
| — Late June 2020 | 28% | 59% | 11% | 3% | (867) |
| — Early June 2020 | 46% | 43% | 8% | 2% | (807) |
| — May 2020 | 51% | 33% | 13% | 2% | (808) |
| — April 2020 | 38% | 48% | 12% | 2% | (857) |
| — March 2020 | 38% | 45% | 14% | 3% | (851) |
| Health agencies in the federal government | 52% | 38% | 6% | 3% | (802) |
| — July 2021 | 57% | 33% | 7% | 3% | (804) |
| — June 2021 | 55% | 33% | 6% | 5% | (810) |
| — April 2021 | n/a | n/a | n/a | n/a | n/a |
| — March 2021 | 50% | 37% | 8% | 5% | (802) |
| — January 2021 | 52% | 40% | 6% | 3% | (809) |
| — Early September 2020 | n/a | n/a | n/a | n/a | n/a |
| — August 2020 | 46% | 43% | 6% | 4% | (868) |
| — Late June 2020 | n/a | n/a | n/a | n/a | n/a |
| — Early June 2020 | 57% | 34% | 5% | 3% | (807) |
| — May 2020 | 63% | 25% | 7% | 4% | (808) |
| — April 2020 | 66% | 25% | 4% | 4% | (857) |
| — March 2020 | 65% | 24% | 8% | 4% | (851) |
28.When do you think the country will get the outbreak under control and be able to return to normal – in the next month or two, by the end of the year, sometime next year, later than that, or never?
| Sept. 2021 | |
| In the next month or two | 3% |
| By the end of the year | 8% |
| Sometime next year | 34% |
| Later than that | 28% |
| Never | 22% |
| (VOL) Don’t know | 4% |
| (n) | (802) |
29.Would you say that federal health agencies, like the C.D.C., have been largely consistent in the messages they have been giving about Covid risks or have they been giving mixed messages about Covid risks?
| TREND: | Sept. 2021 | July 2021 |
| Largely consistent | 36% | 39% |
| Mixed messages | 61% | 59% |
| (VOL) Don’t know | 3% | 3% |
| (n) | (802) | (804) |
30.Have you received at least one dose of Covid vaccine, or not?[If NOT:] Do you plan to get the Covid vaccine as soon as possible, will you continue to let other people get it first to see how it goes, or is it likely you will never get the vaccine if you can avoid it?
| TREND: | Sept. 2021 | July 2021 | June 2021 | April 2021 | March 2021 | Jan. 2021 |
| Already received vaccine | 75% | 68% | 66% | 51% | 16%* | 6%* |
| As soon as possible | 2% | 2% | 2% | 14% | 38% | 50% |
| See how it goes | 6% | 9% | 9% | 12% | 21% | 19% |
| Likely will never get vaccine | 15% | 17% | 21% | 21% | 24% | 24% |
| (VOL) Don’t know | 2% | 4% | 2% | 2% | 1% | 2% |
| (n) | (802) | (804) | (810) | (800) | (802) | (809) |
* January/March 2021 polls did not specifically ask if person already got the vaccine, but included it as a volunteered response.
31.How likely are you to get a booster shot of the vaccine if it is made available – very likely, somewhat likely, not too likely, or not at all likely?
| Sept. 2021 | |
| Very likely | 51% |
| Somewhat likely | 16% |
| Not too likely | 6% |
| Not at all likely | 9% |
| (VOL) Have already gotten one | 1% |
| (VOL) Don’t know | 1% |
| Likely will never get vaccine (from Q30) | 17% |
| (n) | (802) |
32.Do you support or oppose instituting, or reinstituting, face mask and social distancing guidelines in your state at the current time?
| TREND: | Sept. 2021 | July 2021 |
| Support | 63% | 52% |
| Oppose | 34% | 46% |
| (VOL) Depends | 2% | n/a |
| (VOL) Don’t know | 1% | 2% |
| (n) | (802) | (804) |
33.Do you support or oppose requiring that face masks be worn by students, teachers, and staff in schools in your state?
| Sept. 2021 | |
| Support | 66% |
| Oppose | 32% |
| (VOL) Depends | 1% |
| (VOL) Don’t know | 1% |
| (n) | (802) |
34.Do you support or oppose requiring school teachers and staff to get the Covid vaccine?
| Sept. 2021 | |
| Support | 60% |
| Oppose | 36% |
| (VOL) Depends | 3% |
| (VOL) Don’t know | 1% |
| (n) | (802) |
35.Do you support or oppose requiring children who are age 12 and older to get the Covid vaccine in order to attend school in person?
| Sept. 2021 | |
| Support | 51% |
| Oppose | 44% |
| (VOL) Depends | 3% |
| (VOL) Don’t know | 2% |
| (n) | (802) |
[QUESTIONS 36 – 38 WERE ROTATED]
36.Do you support or oppose requiring health care workers to get the Covid vaccine?
| Sept. 2021 | |
| Support | 63% |
| Oppose | 36% |
| (VOL) Depends | 1% |
| (VOL) Don’t know | 1% |
| (n) | (802) |
37.Do you support or oppose requiring federal employees to get the Covid vaccine?
| Sept. 2021 | |
| Support | 58% |
| Oppose | 40% |
| (VOL) Depends | 2% |
| (VOL) Don’t know | 1% |
| (n) | (802) |
38.Do you support or oppose requiring employees of private contractors who work for the federal government to get the Covid vaccine?
| Sept. 2021 | |
| Support | 55% |
| Oppose | 42% |
| (VOL) Depends | 2% |
| (VOL) Don’t know | 1% |
| (n) | (802) |
39.Do you support or oppose requiring people to show proof of vaccination in order to participate in the following activities? [ITEMS WERE ROTATED]
Support | Oppose | (VOL) Depends | (VOL) Don’t know | (n) | |
| Dine inside a restaurant | 46% | 51% | 2% | 1% | (802) |
| Go to a gym | 50% | 49% | 1% | 1% | (802) |
| Fly on a plane | 59% | 40% | 1% | 1% | (802) |
| Go to an outdoor arena for sports or a concert | 46% | 52% | 1% | 1% | (802) |
| Go to an indoor arena for sports or a concert | 55% | 44% | 1% | 0% | (802) |
| Go to work in an office or setting where they are around other people | 53% | 45% | 2% | 1% | (802) |
METHODOLOGY
The Monmouth University Poll was sponsored and conducted by the Monmouth University Polling Institute from September 9 to 13, 2021 with a national random sample of 802 adults age 18 and older. This includes 281 contacted by a live interviewer on a landline telephone and 521 contacted by a live interviewer on a cell phone, in English. Telephone numbers were selected through a mix of random digit dialing and list-based sampling. Landline respondents were selected with a modified Troldahl-Carter youngest adult household screen. Monmouth is responsible for all aspects of the survey design, data weighting and analysis. The full sample is weighted for region, age, education, gender and race based on US Census information (ACS 2018 one-year survey). Data collection support provided by Braun Research (field), Dynata (RDD sample), and Aristotle (list sample). For results based on this sample, one can say with 95% confidence that the error attributable to sampling has a maximum margin of plus or minus 3.5 percentage points (unadjusted for sample design). Sampling error can be larger for sub-groups (see table below). In addition to sampling error, one should bear in mind that question wording and practical difficulties in conducting surveys can introduce error or bias into the findings of opinion polls.
| DEMOGRAPHICS (weighted) |
| Self-Reported |
| 26% Republican |
| 41% Independent |
| 33% Democrat |
| 48% Male |
| 52% Female |
| 30% 18-34 |
| 32% 35-54 |
| 38% 55+ |
| 63% White |
| 12% Black |
| 17% Hispanic |
| 8% Asian/Other |
| 70% No degree |
| 30% 4 year degree |
Click on pdf file link below for full methodology and crosstabs by key demographic groups.