
West Long Branch, NJ – Former President Donald Trump now holds an advantage over Florida Gov. Ron DeSantis as Republican voters’ preference for the party’s 2024 nomination. The Monmouth (“Mon-muth”) University Poll shows Trump has made gains among nearly every voting bloc since the start of the year and is especially popular among strong MAGA supporters. [Note: most of the poll interviews were conducted before reports emerged about a potential indictment of the former president.]
When asked who they would like to see as the Republican nominee for president in 2024, 41% name Trump and 27% name DeSantis. These two have dominated top-of-mind preferences of GOP voters since Monmouth started polling the 2024 contest late last year, but there has been a significant shift between them over that time. The two were tied in February (33% each) while the December results showed a greater preference for the Florida governor (39%) than the former president (26%).
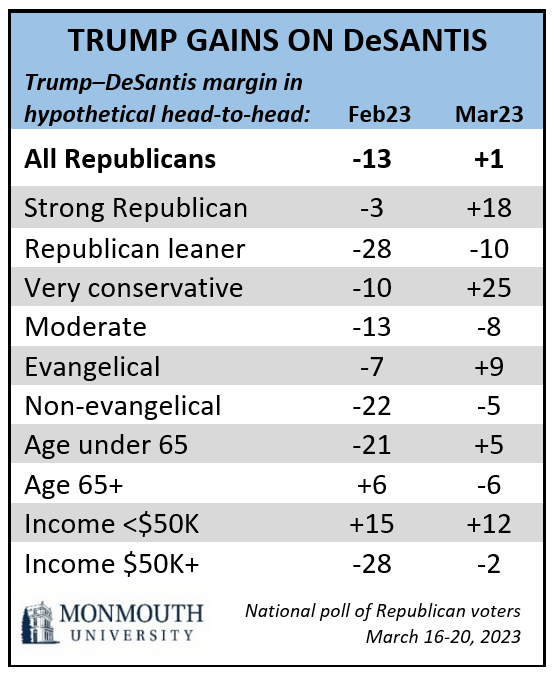
In a hypothetical head-to-head contest, 47% of Republican voters would choose Trump for the party’s nomination and 46% would pick DeSantis. Just over a month ago, DeSantis (53%) had more support than Trump (40%). In February, DeSantis led Trump among almost every major demographic group. Trump now leads among many of these blocs.
Some of Trump’s broadest support comes from Republicans who identify as strong supporters of MAGA – the Make America Great Again movement within the party. These voters – who represent nearly 4 in 10 Republicans nationally – overwhelming prefer Trump (73%) to DeSantis (25%) in a head-to-head contest. DeSantis is preferred by those who only support MAGA somewhat (61% to 32% for Trump), as well as Republicans who do not consider themselves to be MAGA supporters at all (57% to 31%). Overall, 73% of GOP voters say the MAGA movement has been good for the party. Just 20% say it has been bad. Even among Republicans who are not MAGA supporters themselves, 34% say the movement has been good for the party.
“The movement Trump created is sticking by their standard-bearer. That’s enough for Trump to overcome weaker support among the less MAGA portion of the Republican electorate, at least for now,” said Patrick Murray, director of the independent Monmouth University Polling Institute.
The poll also looked at other possible matchups in the Republican contest for president that include former South Carolina Gov. and U.N. Ambassador Nikki Haley and former Vice President Mike Pence – neither of whom register more than a few percentage points as top-of-mind preferences for the nomination. Trump is the overwhelming favorite against either of them in a direct matchup – taking 70% to 23% against Haley and 73% to 21% against Pence. In a hypothetical four-way contest, Trump (44%) holds a nominal lead over DeSantis (36%), with Pence (7%) and Haley (6%) trailing far behind.
“Trump’s support seems to be pretty stable right now. The more candidates who get involved in the race the more it seems to spread out the anti-Trump vote. However, that only seems to have an impact on DeSantis, as no other potential candidate registers significant strength at this time,” said Murray.
The Monmouth University Poll also tested overall views of current and potential Republican contenders. GOP voters hold overwhelmingly positive views of both Trump (71% favorable and 21% unfavorable) and DeSantis (76% favorable and 8% unfavorable). Opinion of Pence is divided at 42% favorable and 37% unfavorable. Haley gets a net positive 45% favorable and 16% unfavorable rating, but nearly 4 in 10 Republican voters have no opinion of her.
The ratings for Trump, DeSantis, and Haley are similar to their February numbers. Pence, though, has seen his favorable number drop by 13 points and unfavorable number increase by 9 points since last month. The only other potential candidate tested in the poll who has a more negative rating than Pence is former New Jersey Gov. Chris Christie at 24% favorable and 42% unfavorable.
The Monmouth University Poll was conducted by telephone and online from March 16 to 20, 2023 with 521 Republican and Republican leaning voters in the United States. The question results in this release have a margin of error of +/- 6.6 percentage points for the full sample. The poll was conducted by the Monmouth University Polling Institute in West Long Branch, NJ.
QUESTIONS AND RESULTS
(* Some columns may not add to 100% due to rounding.)
1.Looking ahead, who would you like to see as the Republican nominee for President in 2024? [LIST WAS NOT READ]
| Trend: | March 2023 | Feb. 2023 | Dec. 2022 |
|---|---|---|---|
| Donald Trump | 41% | 33% | 26% |
| Ron DeSantis | 27% | 33% | 39% |
| Nikki Haley | 3% | 1% | 1% |
| Ted Cruz | 1% | 1% | 1% |
| Rand Paul | 1% | 1% | 0% |
| Mike Pence | 1% | 2% | 2% |
| Condoleezza Rice | 1% | n/a | n/a |
| Tim Scott | 1% | n/a | n/a |
| Mike Pompeo | <1% | 1% | 0% |
| Others | 3% | 4% | 6% |
| (VOL) Don’t know | 23% | 24% | 25% |
| (n) | (521) | (566) | (563) |
2.I’m going to read you the names of some leaders in the Republican Party. Please tell me if your general impression of each is favorable or unfavorable, or if you don’t really have an opinion. If you have not heard of the person, just let me know. First, [READ NAME]. [NAMES WERE ROTATED]
| Trend: | Favorable | Unfavorable | No opinion | Not heard of | (n) |
|---|---|---|---|---|---|
| Former President Donald Trump | 71% | 21% | 8% | 0% | (521) |
| — Feb. 2023 | 74% | 18% | 8% | 0% | (566) |
| Florida Governor Ron DeSantis | 76% | 8% | 11% | 5% | (521) |
| — Feb. 2023 | 80% | 6% | 11% | 3% | (566) |
| Former Vice President Mike Pence | 42% | 37% | 21% | 0% | (521) |
| — Feb. 2023 | 55% | 28% | 17% | 0% | (566) |
| Former Secretary of State Mike Pompeo | 42% | 16% | 34% | 8% | (521) |
| — Feb. 2023 | 41% | 16% | 36% | 8% | (566) |
| Former South Carolina Governor and U.N. Ambassador Nikki Haley | 45% | 16% | 23% | 16% | (521) |
| — Feb. 2023 | 47% | 11% | 22% | 19% | (566) |
| Business entrepreneur Vivek Ramaswamy | 17% | 6% | 28% | 49% | (521) |
| — Feb. 2023 | n/a | n/a | n/a | n/a | (566) |
| Former Cranston, Rhode Island Mayor Steve Laffey | 4% | 8% | 34% | 55% | (521) |
| — Feb. 2023 | n/a | n/a | n/a | n/a | (566) |
| South Carolina Senator Tim Scott | 43% | 6% | 31% | 20% | (521) |
| — Feb. 2023 | n/a | n/a | n/a | n/a | (566) |
| Former Arkansas Governor Asa Hutchinson | 18% | 9% | 45% | 29% | (521) |
| — Feb. 2023 | n/a | n/a | n/a | n/a | (566) |
| Former National Security Advisor John Bolton | 16% | 30% | 33% | 20% | (521) |
| — Feb. 2023 | n/a | n/a | n/a | n/a | (566) |
| Florida Senator Rick Scott | 42% | 11% | 30% | 17% | (521) |
| — Feb. 2023 | n/a | n/a | n/a | n/a | (566) |
| New Hampshire Governor Chris Sununu | 15% | 16% | 32% | 37% | (521) |
| — Feb. 2023 | n/a | n/a | n/a | n/a | (566) |
| Former New Jersey Governor Chris Christie | 24% | 42% | 28% | 6% | (521) |
| — Feb. 2023 | n/a | n/a | n/a | n/a | (566) |
| Virginia Governor Glenn Youngkin | 34% | 7% | 31% | 28% | (521) |
| — Feb. 2023 | 36% | 8% | 30% | 26% | (566) |
| Texas Senator Ted Cruz | 65% | 18% | 15% | 2% | (521) |
| — Feb. 2023 | 73% | 13% | 12% | 1% | (566) |
3.Who would you choose if the candidates for the Republican nomination were Donald Trump, Ron DeSantis, Mike Pence, and Nikki Haley? [NAMES WERE ROTATED]
| Response: | March 2023 |
|---|---|
| Trump | 44% |
| DeSantis | 36% |
| Pence | 7% |
| Haley | 6% |
| (VOL) None | 1% |
| (VOL) Don’t know | 5% |
| (n) | (521) |
[QUESTIONS 4 & 5 WERE ROTATED]
4.Who would you choose if the candidates for the Republican nomination were Donald Trump, Ron DeSantis, and Nikki Haley? [NAMES WERE ROTATED]
| Response: | March 2023 |
|---|---|
| Trump | 45% |
| DeSantis | 40% |
| Haley | 9% |
| (VOL) None | 2% |
| (VOL) Don’t know | 5% |
| (n) | (521) |
5.Who would you choose if the candidates for the Republican nomination were Donald Trump, Mike Pence, and Nikki Haley? [NAMES WERE ROTATED]
| Response: | March 2023 |
|---|---|
| Trump | 67% |
| Pence | 11% |
| Haley | 15% |
| (VOL) None | 2% |
| (VOL) Don’t know | 5% |
| (n) | (521) |
[QUESTIONS 6–8 WERE ROTATED]
6.Who would you choose if the candidates for the Republican nomination were Donald Trump and Ron DeSantis? [NAMES WERE ROTATED]
| Trend: | March 2023 | Feb. 2023 |
|---|---|---|
| Trump | 47% | 40% |
| DeSantis | 46% | 53% |
| (VOL) Neither | 2% | 2% |
| (VOL) Don’t know | 5% | 5% |
| (n) | (521) | (566) |
7.Who would you choose if the candidates for the Republican nomination were Donald Trump and Mike Pence? [NAMES WERE ROTATED]
| Response: | March 2023 |
|---|---|
| Trump | 73% |
| Pence | 21% |
| (VOL) Neither | 2% |
| (VOL) Don’t know | 4% |
| (n) | (521) |
8.Who would you choose if the candidates for the Republican nomination were Donald Trump and Nikki Haley? [NAMES WERE ROTATED]
| Response: | March 2023 |
|---|---|
| Trump | 70% |
| Haley | 23% |
| (VOL) Neither | 2% |
| (VOL) Don’t know | 5% |
| (n) | (521) |
9.Would you describe yourself as a born-again or evangelical Christian, or not?
| Response: | March 2023 |
|---|---|
| Yes | 53% |
| No | 46% |
| (VOL) Don’t know | 1% |
| (n) | (521) |
10.Overall do you think the MAGA – or Make America Great Again – movement is good or bad for the Republican Party?
| Response: | March 2023 |
|---|---|
| Good | 73% |
| Bad | 20% |
| (VOL) Don’t know | 7% |
| (n) | (521) |
11.Would you describe yourself as a supporter of the MAGA movement, or not? [If YES: Do you support MAGA strongly or just somewhat?]
| Response: | March 2023 |
|---|---|
| Supporter, strong | 38% |
| Supporter, somewhat | 28% |
| Not a supporter | 28% |
| (VOL) Don’t know | 6% |
| (n) | (521) |
12.Can someone who opposes the MAGA movement be considered a good Republican, or not?
| Response: | March 2023 |
|---|---|
| Can | 64% |
| Cannot | 26% |
| (VOL) Don’t know | 10% |
| (n) | (521) |
Methodology
The Monmouth University Poll was sponsored and conducted by the Monmouth University Polling Institute from March 16 to 20, 2023 with a probability-based national random sample of 521 registered voters who identify with or lean toward the Republican Party. Interviews were conducted in English, and included 170 live landline telephone interviews, 196 live cell phone interviews, and 155 online surveys via a cell phone text invitation. Telephone numbers were selected through a mix of random digit dialing and list-based sampling. Landline respondents were selected with a modified Troldahl-Carter youngest adult household screen. Interviewing services were provided by Braun Research, with sample obtained from Dynata (RDD, n= 200), Aristotle (list, n= 251) and a panel of prior Monmouth poll participants (n= 70). Monmouth is responsible for all aspects of the survey design, data weighting and analysis. The full sample is weighted for region, age, education, gender and race based on voter list and US Census information (ACS 2021 one-year survey). For results based on this sample, one can say with 95% confidence that the error attributable to sampling has a maximum margin of plus or minus 6.6 percentage points (adjusted for sample design effects). Sampling error can be larger for sub-groups (see table below). In addition to sampling error, one should bear in mind that question wording and practical difficulties in conducting surveys can introduce error or bias into the findings of opinion polls.
DEMOGRAPHICS (weighted) |
| Self-Reported |
| 47% Strong Republican |
| 23% Republican, not strong |
| 31% Independent, lean Rep. |
| 53% Male |
| 47% Female |
| 16% 18-34 |
| 24% 35-49 |
| 32% 50-64 |
| 28% 65+ |
| 81% White |
| 11% Hispanic |
| 8% Black/Asian/Other |
| 40% High school or less |
| 32% Some college |
| 28% 4 year degree |
Click on pdf file link below for full methodology and crosstabs by key demographic groups.