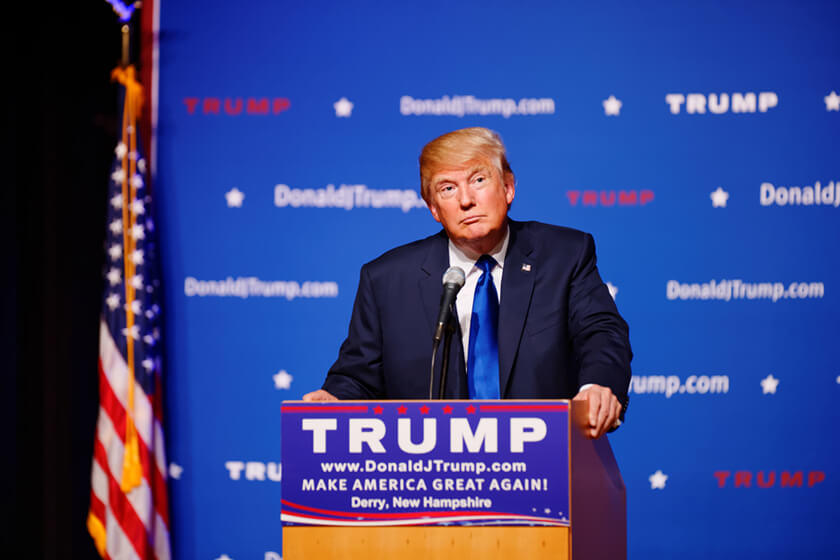
West Long Branch, NJ – At least 7-in-10 likely GOP primary voters in New Hampshire will be sticking with President Donald Trump in 2020 according to the Monmouth University Poll. In fact, two-thirds of Granite State Republicans say they would have voted for him in the 2016 primary if they could do it over again – which is nearly double the level of support he actually got three years ago.
A majority (55%) of likely Republican primary voters in New Hampshire say that Trump should be able to run unopposed for renomination in 2020. Just one-third would prefer to see him face a primary challenge, including 9% who have a specific candidate in mind and 25% who would just like to see a primary challenge in general. Names mentioned as preferred challengers include former Ohio Gov. John Kasich, former Massachusetts Gov. William Weld, Kentucky Sen. Rand Paul, and Utah Sen. Mitt Romney.
A majority of self-described moderates along with a smattering of liberals who make up about one third of the likely GOP electorate want Trump to face a primary challenge. Just over half (54%) express this view while 39% of these nonconservatives say the president should run unopposed. On the other hand, a majority of very conservative (72%) and somewhat conservative (54%) voters say Trump should be given a clear path to the 2020 nomination.
Weld is the only announced high-profile challenger to Trump at this point, but he doesn’t fare well in a head-to-head matchup. Just 12% of likely Granite State primary voters say they would back Weld in a contested primary and another 14% say they would possibly consider voting for Weld. The vast majority (72%) firmly back Trump in this contest.
“It’s a sign of how much Trump has won over the hearts and minds of the Republican base that likely primary voters do not actually want to see a contested primary,” said Patrick Murray, director of the independent Monmouth University Polling Institute.
Trump won New Hampshire’s “First in the Nation” primary three years ago with 35% of the vote. He would nearly double that support today if likely GOP voters could go back in time and recast their ballots for the Republican nomination. In a 2016 do-over, 68% say they would now vote for Trump compared to 21% who would support one of the other candidates who ran and 10% who are unsure of what they would do.
“Most New Hampshire Republicans did not support Trump in the 2016 primary, but there seems to be few regrets now that he is in office,” said Murray.
Currently, 65% of New Hampshire GOP primary voters have a very favorable opinion of the president and another 21% have a somewhat favorable opinion of him. Just 13% have an unfavorable opinion (9% very and 4% somewhat). Very favorable opinions of the incumbent come from 83% of very conservative voters, 66% of somewhat conservative voters, and 44% of nonconservatives.
Just 1-in-4 voters have a favorable opinion of Weld (4% very and 20% somewhat) while nearly half have an unfavorable opinion (29% very and 19% somewhat). Another 18% have no opinion of the former governor from neighboring Massachusetts and 10% have not heard of him. Unfavorable opinions of Weld come from 65% of very conservative voters, 44% of somewhat conservative voters, and 32% of nonconservatives.
One-third of voters have a favorable opinion of Kasich (11% very and 23% somewhat) while just under half have an unfavorable opinion (25% very and 19% somewhat). Another 16% have no opinion of Kasich and 7% have not heard of the person who placed second in the 2016 New Hampshire primary. Unfavorable opinions of Kasich come from 56% of very conservative voters, 43% of somewhat conservative voters, and 32% of nonconservatives.
Few voters are familiar with Maryland Gov. Larry Hogan, who has indicated he may wade into the 2020 primary contest. Just 4% have a favorable opinion of him (1% very and 3% somewhat) and 19% have an unfavorable opinion (12% very and 7% somewhat) while 22% have no opinion and 54% have not heard of him.
The Monmouth University Poll was conducted by telephone from May 2 to 7, 2019 with 427 New Hampshire voters who are likely to vote in the Republican presidential primary in February 2020, out of 987 registered voters that were contacted for the poll. The question results in this release have a margin of error of +/- 4.8 percentage points. The poll was conducted by the Monmouth University Polling Institute in West Long Branch, NJ.
QUESTIONS AND RESULTS
(* Some columns may not add to 100% due to rounding.)
A1/A2. I know the 2020 election is far away, but would you prefer that Donald Trump run unopposed for the Republican nomination or would you prefer to see him face a primary challenge in 2020? Is there any Republican in particular that you would like to see run against Donald Trump?
|
May 2019 | |
| Trump run unopposed | 55% |
| Face a primary challenge, specific name | 9% |
| Face a primary challenge, general | 25% |
| (VOL) Don’t know | 11% |
| (n) | (427) |
A3. If the Republican primary election for president was today, would you vote for Donald Trump or William Weld? [If TRUMP or UNSURE: Is it at least somewhat possible that you would support Weld over Trump or is it not at all possible?] [NAMES WERE ROTATED]
|
May 2019 | |
| Donald Trump, firm | 72% |
| William Weld | 12% |
| Possible Weld | 14% |
| (VOL) Other, neither | 1% |
| Undecided | 2% |
| (n) | (427) |
A4. If you were able to go back in time and cast your vote in the 2016 Republican primary for president again, would you support Donald Trump or would you support another candidate who ran, or are you unsure what you would do?
|
May 2019 | |
| Donald Trump | 68% |
| Another candidate | 21% |
| Unsure | 10% |
| (VOL) Would not vote | 1% |
| (n) | (427) |
A5. I’m going to read you a few names of people who may be running for president in 2020. Please tell me if your general impression of each is very favorable, somewhat favorable, somewhat unfavorable, or very unfavorable, or if you don’t really have an opinion. If you have not heard of the person, just let me know. [NAMES WERE ROTATED]
| Very Favorable | Somewhat favorable | Somewhat unfavorable | Very unfavorable | No opinion | Not heard of | (n) | |
| President Donald Trump | 65% | 21% | 4% | 9% | 1% | 0% | (427) |
| Former Massachusetts Governor William Weld | 4% | 20% | 19% | 29% | 18% | 10% | (427) |
| Maryland Governor Larry Hogan | 1% | 3% | 7% | 12% | 22% | 54% | (427) |
| Former Ohio Governor John Kasich | 11% | 23% | 19% | 25% | 16% | 7% | (427) |
METHODOLOGY
The Monmouth University Poll was sponsored and conducted by the Monmouth University Polling Institute from May 2 to 7, 2019 with a statewide random sample of 987 New Hampshire voters drawn from a list of registered voters who participated in a primary election in the past two election cycles or voted in both the 2016 and 2018 general elections. Results are based on 427 voters who are likely to vote in the Republican presidential primary in February 2020. This includes 248 contacted by a live interviewer on a landline telephone and 179 contacted by a live interviewer on a cell phone, in English. Monmouth is responsible for all aspects of the survey design, data weighting and analysis. Final sample is weighted for party registration, age, gender, race, and education based on state voter registration list information and U.S. Census information. Data collection support provided by Braun Research (field) and Aristotle (voter sample). For results based on the sample of 427 likely Republican primary voters, one can say with 95% confidence that the error attributable to sampling has a maximum margin of plus or minus 4.8 percentage points (unadjusted for sample design). Sampling error can be larger for sub-groups (see table below). In addition to sampling error, one should bear in mind that question wording and practical difficulties in conducting surveys can introduce error or bias into the findings of opinion polls.
| DEMOGRAPHICS (weighted) |
| Party Registration |
| 69% Republican |
| 31% None, other |
| Self-Reported Party |
| 59% Republican |
| 41% Other |
| 56% Male |
| 44% Female |
| 6% 18-34 |
| 21% 35-49 |
| 39% 50-64 |
| 33% 65+ |
| 97% White, non-Hispanic |
| 3% Other race, Hispanic |
| 64% No college degree |
| 36% College graduate |
Click on pdf file link below for full methodology and crosstabs by key demographic groups.