West Long Branch, NJ – Donald Trump and Joe Biden are engaged in a tight race for Georgia’s electoral votes according to the Monmouth (“Mon-muth”) University Poll. Republicans, on the other hand, are in a good position to retain both of the state’s U.S. Senate seats. At the ballot box, voters are more concerned about potential voter disenfranchisement than voter fraud. In other issues, Georgians part ways with their governor over requiring face masks to be worn during the pandemic, including allowing cities to set their own rules. The poll also finds largely positive opinion of the late congressman and civil rights leader John Lewis, although voters are divided on whether the state should erect a prominent monument to him.
Among all registered voters in Georgia, Trump is supported by 47% and Biden is supported by 47%, with 3% saying they will vote for Libertarian Jo Jorgensen and 3% who are undecided. These results include 42% who are certain to vote for Trump and 39% who say the same for Biden. At the other end of the spectrum, 45% say they are not at all likely to vote for the incumbent and 44% say the same for challenger.
The two major party candidates are in strong positions with their fellow partisans – Biden among Democrats (96% to 3%) and Trump among Republicans (92% to 7%). Biden has a sizable advantage among independents (53% to 31%). Black voters choose Biden (89% to 5%), while white voters back Trump (69% to 27%). Trump has leads among white voters without a college degree (73% to 22%) as well as white college graduates (59% to 36%) in Georgia.
“There is a lot of parity between the two candidates. Trump has a lock on his base but Biden is performing much better than Clinton did in key swing areas,” said Patrick Murray, director of the independent Monmouth University Polling Institute. Trump won Georgia by five points in 2016.
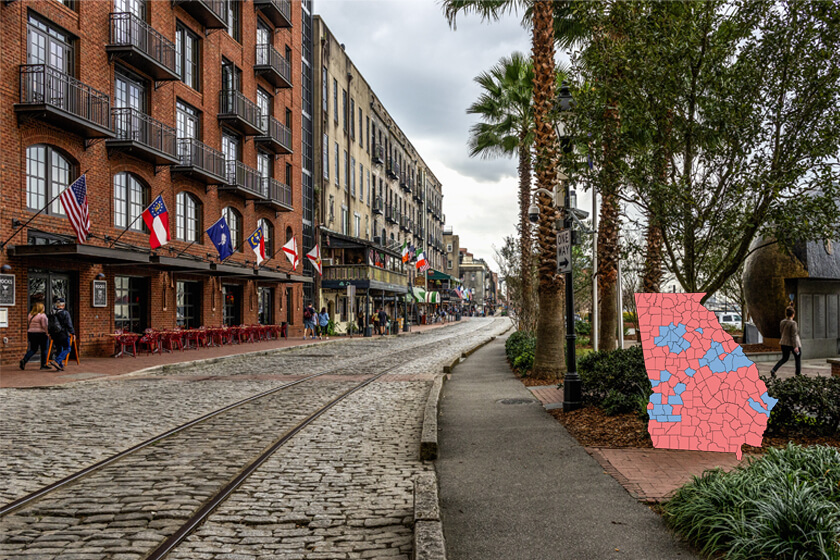
Biden is doing especially well in 14 counties where the vote margins were closest in the 2016 presidential election. The Democrat currently holds a 58% to 38% lead among registered voters in these swing counties* led by the large Atlanta suburbs of Cobb and Gwinnett. The poll also finds that Biden racks up a large margin (71% to 22%) in counties that went solidly for Hillary Clinton in 2016. Trump has a solid lead (68% to 25%) in the counties he won handily four years ago.
| GEORGIA: VOTER MODELS | ||||
| Presidential vote choice: | Registered voters | High likely turnout | Low likely turnout | |
| Trump | 47% | 48% | 49% | |
| Biden | 47% | 47% | 46% | |
| Jorgensen | 3% | 2% | 2% | |
| Undecided | 3% | 3% | 4% | |
| Source: Monmouth University Poll, July 23-27, 2020 | ||||
The race remains tight when different likely voter models are applied. A model based on a higher level of turnout than 2016 puts the race at 48% Trump and 47% Biden while one reflecting lower turnout produces a similar 49% Trump and 46% Biden result. Using the low turnout model, Biden is ahead in the swing counties by 20 points (59% to 39%). Four years ago, Clinton won the cumulative vote in these counties by just under four percentage points. Biden holds a 41 point lead (67% to 26%) in the core Clinton counties – led by Fulton and DeKalb – using the low turnout model, while Trump leads by 45 points (69% to 24%) in his core counties from 2016. The current results are in line with the cumulative margins in the core Clinton (41.1 points) and Trump (43.5 points) counties four years ago.
Overall, 46% of Georgia voters have a favorable opinion of Trump and 45% have an unfavorable one – including 38% very unfavorable. Biden gets a 41% favorable and 46% unfavorable rating, including 34% very unfavorable. Republican voters (48%) are more likely than Democrats (29%) to say they are very optimistic about the 2020 presidential election and that they feel more enthusiastic about this contest compared to past elections (47% Republican and 36% Democrat). Among independent voters, 25% are very optimistic and 28% feel more enthusiastic about November than past elections.
– Senate contests –
In the regularly scheduled U.S. Senate election, Republican incumbent David Perdue holds a 49% to 43% lead over Democratic challenger Jon Ossoff. Libertarian Shane Hazel earns 1% and 7% are undecided. Looking at coattail effects, Perdue has the support of 92% of Trump voters while 5% back Ossoff and 1% are undecided. Perdue picks up 8% of the Biden vote with 83% of this group backing Ossoff and a larger 9% who are undecided. Likely voter models show similar results under either high turnout (50% Perdue and 43% Ossoff) or low turnout (51% Perdue and 43% Ossoff) scenarios.
The state’s other senate seat will also be on the November ballot. This special election will be a blanket primary featuring 20 listed candidates, including six Republicans and eight Democrats. Kelly Loeffler, who was appointed to the seat earlier this year, leads the pack with 26% support, followed by fellow Republican Doug Collins at 20%. Leading Democrats include Matt Lieberman (14%), Raphael Warnock (9%), and Ed Tarver (5%), while Libertarian Brian Slowinski earns 3%. Other candidates were not specifically named but get 5% support as a group. Another 18% of registered voters are undecided. The results for the poll’s likely voter models are nearly identical to these numbers.
Among Trump voters, 47% support Loeffler and 40% back Collins, who currently represents the 9th Congressional District. The president has not endorsed a candidate in this race but has made positive remarks about both leading candidates. Among Biden voters, 28% support Lieberman, the son of a former U.S. Senator and nominee for Vice President, 19% support Warnock, pastor of Ebenezer Baptist Church, 9% back Tarver, a former U.S. Attorney and state legislator, and 7% say they support a candidate not named in the poll. Just 8% of Trump voters are undecided in the special senate race but a larger 23% of Biden supporters are unsure of how they will vote.
“Republicans were unsuccessful in working out a deal between their top contenders, but Democrats seem to face an even messier prospect despite Warnock’s establishment support. The upshot is that this seat will remain in GOP hands unless Democratic support shifts toward one candidate. Of course, this is the most volatile statewide race so it has the most room for movement,” said Murray.
If no candidate gets more than 50% of the vote in November, the top two vote earners will advance to a January 2021 runoff. It is worth noting that 83% of registered voters are certain of how they will vote in the presidential contest and 77% are certain of their choice in the Perdue-Ossoff race, but only 49% are certain about their vote in the special election.
– Pandemic mask mandate –
President Trump earns a split decision from Georgia voters on his handling of the coronavirus outbreak – 48% say he has done a good job and 51% a bad job. Gov. Brian Kemp does slightly better at 54% good job and 45% bad job. A majority (54%) says Kemp has been largely consistent on establishing social distancing and face mask regulations, while 39% say he has been inconsistent.
“Many state governors routinely earn positive ratings in the 60s and 70s for their pandemic response. Kemp is not among them, in part because most Georgians take a different view from him on the issue of wearing masks,” said Murray.
More than 3 in 4 voters (79%) approve of requiring people to wear face masks indoors in public places when they come within six feet of other people and 63% approve of a similar mandate outdoors. Also, 63% say that individual cities should be allowed to establish face mask rules that are stricter than statewide regulations. Just 32% disapprove of allowing cities to do this. Kemp recently filed a lawsuit against Atlanta officials for creating their own social distancing and mask regulations.
– Voting concerns –
Voter fraud – such as ballots being cast by people who are not eligible to vote or who vote multiple times – is considered to be a major problem in Georgia by 37% of voters. Another 29% say it is a minor problem and 27% not a problem. At the same time, voter disenfranchisement – such as eligible voters being prevented from casting their ballots or not having their ballots counted – is seen as a major problem by 46% of voters. Another 21% say this is a minor problem and 25% not a problem.
Republicans (47%) are somewhat more likely than Democrats (28%) and independents (34%) to see voter fraud as a major problem, while Democrats (69%) and independents (52%) are much more likely than Republicans (25%) to see voter disenfranchisement as a major problem. When the two concerns are combined, 21% of Georgia voters see both fraud and disenfranchisement as major problems while just 7% see neither as a problem at all.
“Voter fraud has become a talking point for Republicans, but recent election meltdowns in Georgia have made voters sensitive to potential disenfranchisement as well,” said Murray.
While just 7% of Georgia voters report usually voting by mail, over 4 in 10 say they are either very (26%) or somewhat (17%) likely to do so in November. Democrats (60%) and independents (46%) are more likely than Republicans (28%) to say they are at least somewhat likely to vote by mail this fall.
– John Lewis –
As the nation and state mourn the passing of Rep. Lewis, 53% of Georgia voters say they have a favorable opinion of the late civil rights leader and just 8% have an unfavorable view of him. Another 38% have no opinion. Republicans (53%) are more likely than independents (35%) and Democrats (22%) to have no opinion of Lewis.
Just under half (45%) of the state’s electorate say that Georgia should erect a statue or some other prominent monument to Lewis, while 37% disagree. Among Black voters, 65% agree with building such a tribute to Lewis and 22% disagree. Among white voters who identify as Democrats or independents, 42% agree and 35% disagree. Among white voters who identify as Republicans, just 30% agree with erecting a monument while 52% disagree.
The Monmouth University Poll was conducted by telephone from July 23 to 27, 2020 with 402 Georgia registered voters. The question results in this release have a margin of error of +/- 4.9 percentage points. The poll was conducted by the Monmouth University Polling Institute in West Long Branch, NJ.
* 2016 presidential margin by county groupings:
Swing (21% of turnout) – 14 counties where the winning margin for either candidate was less than 10 points, with a cumulative vote of 49.6% Clinton and 46.0% Trump.
Clinton (34% of turnout) – 22 counties Clinton won by more than 10 points, with a cumulative vote of 68.8% to 27.7%.
Trump (45% of turnout) – 123 counties Trump won by more than 10 points, with a cumulative vote of 70.1% to 26.6%.
QUESTIONS AND RESULTS
(* Some columns may not add to 100% due to rounding.)
1.If the election for President was today, would you vote for … Donald Trump the Republican, Joe Biden the Democrat, or Jo Jorgensen the Libertarian? [NAMES WERE ROTATED] [If UNDECIDED: If you had to vote for one of the following candidates at this moment, who do you lean toward – Donald Trump or Joe Biden?]
| REGISTERED VOTERS (with leaners) | July 2020 |
| Donald Trump | 47% |
| Joe Biden | 47% |
| Jo Jorgensen | 3% |
| (VOL) Other candidate | <1% |
| (VOL) Undecided | 3% |
| (n) | (402) |
[1A. If Trump/Biden voter, ASK: Are you certain about your vote choice, or might you change your mind before election day?]
[QUESTIONS 2 & 3 WERE ROTATED]
2.What is the likelihood that you might vote for Donald Trump in November – very likely, somewhat likely, not too likely, or not at all likely?
| REGISTERED VOTERS | July 2020 |
| Certain for Trump (from Q1/A) | 42% |
| Very likely | 1% |
| Somewhat likely | 7% |
| Not too likely | 4% |
| Not at all likely | 45% |
| (VOL) Don’t know | 2% |
| (n) | (402) |
3.What is the likelihood that you might vote for Joe Biden in November – very likely, somewhat likely, not too likely, or not at all likely?
| REGISTERED VOTERS | July 2020 |
| Certain for Biden (from Q1/A) | 39% |
| Very likely | 3% |
| Somewhat likely | 9% |
| Not too likely | 4% |
| Not at all likely | 44% |
| (VOL) Don’t know | 2% |
| (n) | (402) |
As you may know, there are two Senate seats on the ballot this November.
4.In the regularly scheduled race, if the election for U.S. Senate was today, would you vote for … David Perdue the Republican, Jon Ossoff the Democrat, or Shane Hazel the Libertarian? [NAMES WERE ROTATED] [If UNDECIDED: If you had to vote for one of the following candidates at this moment, who do you lean toward – David Perdue or Jon Ossoff?]
| REGISTERED VOTERS (with leaners) | July 2020 |
| David Perdue | 49% |
| Jon Ossoff | 43% |
| Shane Hazel | 1% |
| (VOL) No one | <1% |
| (VOL) Undecided | 7% |
| (n) | (402) |
5.The other U.S. Senate race is a special election where all the candidates run on the same ballot. If that election was today, would you vote for … Republican Kelly Loeffler, Republican Doug Collins, Democrat Raphael Warnock, Democrat Matt Lieberman, Democrat Ed Tarver, Libertarian Brian Slowinski, or another candidate? [NAMES WERE ROTATED] [If UNDECIDED: If you had to vote for one of the following candidates at this moment, who do you lean toward –Loeffler, Collins, Warnock, Lieberman, or Tarver?]
| REGISTERED VOTERS (with leaners) | July 2020 |
| Republican Kelly Loeffler | 26% |
| Republican Doug Collins | 20% |
| Democrat Raphael Warnock | 9% |
| Democrat Matt Lieberman | 14% |
| Democrat Ed Tarver | 5% |
| Libertarian Brian Slowinski | 3% |
| Other candidate | 5% |
| (VOL) Undecided | 18% |
| (n) | (402) |
[QUESTIONS 6 & 7 WERE ROTATED]
6.Is your general impression of Donald Trump very favorable, somewhat favorable, somewhat unfavorable, or very unfavorable, or do you have no opinion?
| REGISTERED VOTERS | July 2020 |
| Very favorable | 28% |
| Somewhat favorable | 18% |
| Somewhat unfavorable | 7% |
| Very unfavorable | 38% |
| No opinion | 10% |
| (n) | (402) |
7.Is your general impression of Joe Biden very favorable, somewhat favorable, somewhat unfavorable, or very unfavorable, or do you have no opinion?
| REGISTERED VOTERS | July 2020 |
| Very favorable | 21% |
| Somewhat favorable | 20% |
| Somewhat unfavorable | 12% |
| Very unfavorable | 34% |
| No opinion | 12% |
| (n) | (402) |
8.Do you feel optimistic or pessimistic about the 2020 presidential election? [Is that very or somewhat optimistic/pessimistic]?
| REGISTERED VOTERS | July 2020 |
| Very optimistic | 35% |
| Somewhat optimistic | 31% |
| Somewhat pessimistic | 15% |
| Very pessimistic | 11% |
| (VOL) Neither, don’t care | 5% |
| (VOL) Don’t know | 4% |
| (n) | (402) |
9.How motivated are you to vote in the November election for president – very motivated, somewhat motivated, or not that motivated?
| REGISTERED VOTERS | July 2020 |
| Very motivated | 83% |
| Somewhat motivated | 12% |
| Not that motivated | 5% |
| (VOL) Don’t know | 0% |
| (n) | (402) |
10.Compared to past elections, are you more enthusiastic than usual, less enthusiastic, or about the same as past elections?
| REGISTERED VOTERS | July 2020 |
| More enthusiastic | 38% |
| Less enthusiastic | 15% |
| About the same | 46% |
| (VOL) Don’t know | 1% |
| (n) | (402) |
11.Looking back at recent elections, did you usually vote in person or vote by mail?
| REGISTERED VOTERS | July 2020 |
| In person | 88% |
| By mail | 7% |
| (VOL) Both equally | 1% |
| (VOL) Have not voted in recent elections | 4% |
| (VOL) Don’t know | 1% |
| (n) | (402) |
12.How likely are you to cast your vote by mail this November – very likely, somewhat likely, not too likely, or not at all likely?
| REGISTERED VOTERS | July 2020 |
| Very likely | 26% |
| Somewhat likely | 17% |
| Not too likely | 13% |
| Not at all likely | 42% |
| (VOL) Don’t know | 2% |
| (n) | (402) |
[QUESTIONS 13 & 14 WERE ROTATED]
13.Would you say that voter fraud – that is ballots being cast by people who are not eligible to vote or who vote multiple times – is a major problem, minor problem, or not really a problem in Georgia?
| REGISTERED VOTERS | July 2020 |
| Major problem | 37% |
| Minor problem | 29% |
| Not a problem | 27% |
| (VOL) Don’t know | 7% |
| (n) | (402) |
14.Would you say that voter disenfranchisement – that is eligible voters being prevented from casting their ballots or not having their ballots counted– is a major problem, minor problem, or not really a problem in Georgia?
| REGISTERED VOTERS | July 2020 |
| Major problem | 46% |
| Minor problem | 21% |
| Not a problem | 25% |
| (VOL) Don’t know | 7% |
| (n) | (402) |
[QUESTIONS 15 & 16 WERE ROTATED]
15.Has Donald Trump done a good job or bad job handling the coronavirus outbreak? [Is that very or somewhat good/bad?]
| REGISTERED VOTERS | July 2020 |
| Very good | 31% |
| Somewhat good | 17% |
| Somewhat bad | 10% |
| Very bad | 41% |
| (VOL) Don’t know | 1% |
| (n) | (402) |
16.Has Governor Brian Kemp done a good job or bad job handling the coronavirus outbreak? [Is that very or somewhat good/bad?]
| REGISTERED VOTERS | July 2020 |
| Very good | 29% |
| Somewhat good | 25% |
| Somewhat bad | 15% |
| Very bad | 30% |
| (VOL) Don’t know | 2% |
| (n) | (402) |
[QUESTIONS 17 & 18 WERE ROTATED]
17.Do you approve or disapprove of requiring people to wear face masks when they come within six feet of others in public places indoors?
| REGISTERED VOTERS | July 2020 |
| Approve | 79% |
| Disapprove | 17% |
| (VOL) Depends | 3% |
| (VOL) Don’t know | 1% |
| (n) | (402) |
18.Do you approve or disapprove of requiring people to wear face masks when they come within six feet of others in public places outdoors?
| REGISTERED VOTERS | July 2020 |
| Approve | 63% |
| Disapprove | 33% |
| (VOL) Depends | 4% |
| (VOL) Don’t know | 0% |
| (n) | (402) |
19.Should individual cities be allowed to establish rules about wearing face masks that are stricter than the statewide rules, or should they not be allowed to do this?
| REGISTERED VOTERS | July 2020 |
| Should be allowed | 63% |
| Should not be allowed | 32% |
| (VOL) Depends | 3% |
| (VOL) Don’t know | 3% |
| (n) | (402) |
20.Has Governor Kemp been largely consistent or largely inconsistent in establishing social distancing and face mask regulations for the state?
| REGISTERED VOTERS | July 2020 |
| Consistent | 54% |
| Inconsistent | 39% |
| (VOL) Depends | 1% |
| (VOL) Don’t know | 5% |
| (n) | (402) |
21.Is your general impression of the late Congressman John Lewis very favorable, somewhat favorable, somewhat unfavorable, or very unfavorable, or do you have no opinion?
| REGISTERED VOTERS | July 2020 |
| Very favorable | 37% |
| Somewhat favorable | 16% |
| Somewhat unfavorable | 4% |
| Very unfavorable | 4% |
| No opinion | 38% |
| (n) | (402) |
22.Do you agree or disagree that Georgia should erect a statue or some other prominent monument to Congressman Lewis?
| REGISTERED VOTERS | July 2020 |
| Agree | 45% |
| Disagree | 37% |
| (VOL) Depends | 3% |
| (VOL) Don’t know | 15% |
| (n) | (402) |
METHODOLOGY
The Monmouth University Poll was sponsored and conducted by the Monmouth University Polling Institute from July 23 to 27, 2020 with a statewide random sample of 402 Georgia voters drawn from a list of registered voters. This includes 141 contacted by a live interviewer on a landline telephone and 261 contacted by a live interviewer on a cell phone, in English. Monmouth is responsible for all aspects of the survey design, data weighting and analysis. The full sample is weighted for party primary vote history, age, gender, race, education, and region based on state voter registration list information and U.S. Census information (CPS 2018 supplement). Data collection support provided by Braun Research (field) and Aristotle (voter sample). For results based on the full voter sample, one can say with 95% confidence that the error attributable to sampling has a maximum margin of plus or minus 4.9 percentage points (unadjusted for sample design). Sampling error can be larger for sub-groups (see table below). In addition to sampling error, one should bear in mind that question wording and practical difficulties in conducting surveys can introduce error or bias into the findings of opinion polls.
| DEMOGRAPHICS (weighted) |
| REGISTERED VOTERS |
| Party primary history |
| 37% Republican |
| 31% Other/none |
| 32% Democrat |
| Self-Reported Party |
| 38% Republican |
| 33% Independent |
| 28% Democrat |
| 46% Male |
| 54% Female |
| 26% 18-34 |
| 25% 35-49 |
| 26% 50-64 |
| 23% 65+ |
| 62% White, non-Hispanic |
| 31% Black |
| 4% Hispanic |
| 2% Asian |
| 2% Other race |
| 66% No degree |
| 34% 4 year degree |
Click on pdf file link below for full methodology and crosstabs by key demographic groups.