West Long Branch, NJ – The race to fill the open seat in Ohio’s 12th Congressional District has shifted from a Republican advantage last month to a toss-up now, according to the Monmouth University Poll. Different voter models suggest that the race could go either way. The underlying GOP-lean of this district benefits State Senator Troy Balderson. But an increase in Democratic enthusiasm and a shift in independent voter preferences have boosted the standing of Franklin County Recorder Danny O’Connor.
In the special election to be held next Tuesday, Balderson the Republican has 44% support and O’Connor the Democrat has 43% support among all potential voters – that is voters who have participated in an election since 2010 or have newly registered to vote (a group that represents about 87% of all registered voters in the district). Joe Manchik – the Green Party candidate who got nearly 4% of the vote two years ago – earns just 2%. A relatively large 11% remain undecided. A little over one month ago, Balderson had a 43% to 33% advantage among all potential voters.
Monmouth also looked at the race using three possible turnout models. A standard model that looks like a typical midterm voter pool shows the race basically tied at 46% for Balderson and 45% for O’Connor. Last month, this same model gave the Republican a sizable 48% to 39% advantage. Balderson benefits more under a lower turnout model where only the most reliable voters show up, holding a slight 49% to 44% edge over O’Connor under this scenario. Still, this same model gave the Republican a much healthier 50% to 35% lead just one month ago. In a Democratic “surge” model akin to turnout patterns that have been seen in some but not all special elections held since 2017, O’Connor has 46% and Balderson has 45%. O’Connor trailed in this model last month by 39% to 46% for Balderson. None of the leads in any of these likely voter models is statistically significant.
“This race has definitely tightened in the past month. This is similar to the trend we saw in our polling of the Pennsylvania special election earlier this year. That race ended up with an electorate that looked more like a standard midterm turnout,” said Patrick Murray, director of the independent Monmouth University Polling Institute.
Independent voters are a key factor in the shift in polling since last month, with many moving from being undecided to favoring the Democrat. Currently, independents prefer O’Connor over Balderson by 48% to 32%, with 17% undecided. The independent vote in June’s poll showed a similar level of support for Balderson (33%), but it had a lower vote share for O’Connor (30%) and a larger group who were undecided (33%).
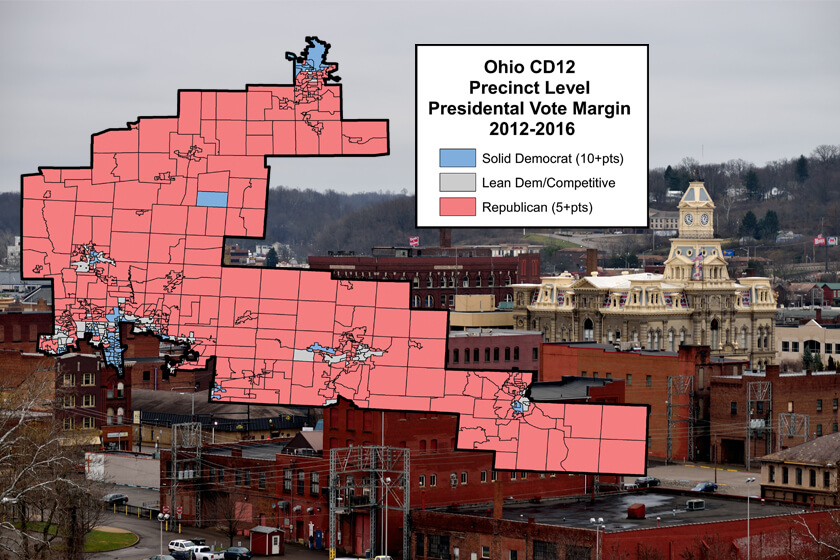
O’Connor does the best in his home region, holding a 54% to 36% lead among Franklin County voters, who make up nearly a third of OH-12’s electorate. Balderson leads by 48% to 38% in the remainder of the district. Balderson’s share of the vote has held steady since June when it was 33% in Franklin and 48% in the rest of the district. O’Connor’s share, on the other hand, has grown in the past month from 43% in Franklin and 29% in the rest of the district.
Voter interest in this special election has increased since June, but it has not done so equally among all partisan groups. Overall, 56% of OH-12 voters now have a lot of interest in next week’s election, up from 38% in June. Democrats lead the pack in expressing a high level of interest at 66%, up 22 points from 44% in June. Just over half of Republicans (55%) also express a lot of interest, but this is up by a relatively lower 15 points from 40% in June. About half of independents (51%) express a lot of interest, which is up 19 points from 32% in June.
“This is still a Republican leaning district with many metrics that continue to favor Balderson, but growing Democratic enthusiasm has made this race surprisingly competitive. O’Connor’s chances hinge on generating a larger than usual share of the vote from the suburbs north of Columbus,” said Murray.
Among the factors working in Balderson’s favor is the fact that OH-12 voters continue to express a slight preference for having the GOP (41%) rather than the Democrats (36%) in control of Congress. This is similar to the Republicans’ 43% to 34% party control edge in Monmouth’s June poll.
Compared to voters in other competitive districts Monmouth has polled, OH-12 voters are more positive about the tax reforms passed by Congress at the end of last year. The GOP-sponsored plan garners 47% approval compared to 35% disapproval. A plurality of 41% expect that their own federal tax burden will remain unchanged under the new code, while others are divided between expecting to see their taxes go up (24%) or go down (23%).
Trade and tariffs, on the other hand, could be a drag on the Republican, especially as this issue impacts the district’s agricultural economy. Just under half of OH-12 voters (46%) say that Pres. Donald Trump’s trade and tariff policies will hurt the local economy compared to 34% who expect these policies will help the economy in central Ohio.
Voter opinion of Trump’s overall job performance stands at 46% approve and 49% disapprove. Last month it stood at a similar 48% approve and 47% disapprove. Just under two-thirds (62%) say it is very important for them to cast a vote for Congress that shows how they feel about the president, which is up from 53% in June. Those who oppose Trump (71%, up from 64% in June) are somewhat more likely than Trump supporters (65%, up from 56% in June) to feel this way, but this gap is not as large as it has been in recent polling conducted by Monmouth in other House races.
“Trump maintains a significant amount of backing in Ohio 12. His just announced plan to hold a rally there this weekend could light a fire under some supporters who were planning to sit this one out. It could be a game changer if it nets a couple of thousand additional votes for Balderson,” said Murray.
About one-third of OH-12 voters (36%) think that, if elected, Balderson would be too supportive of Trump, while 37% feel he would offer the right amount of support and 5% say he would offer too little support. Across the aisle, 30% feel that O’Connor would be too supportive of House Minority Leader Nancy Pelosi, while 36% feel he would offer the right amount of support and 7% say he would offer too little support. O’Connor has consistently said he will not support Pelosi for another term as his party’s leader, but he recently appeared to back off that promise if Democrats gain control of the House and Pelosi won the party conference’s support for Speaker.
“A month ago, Monmouth’s polling suggested that O’Connor may have challenges with both voter persuasion and motivating his base. It seems he has had some success on both fronts. The issues at play now, including tariffs and Pelosi, matter most when it is a game of inches. And this one is a game of inches,” said Murray.
Both candidates have become better known in the past month, but neither seems to have broken out in voter awareness. Balderson currently gets a 33% favorable and 26% unfavorable rating, with 42% having no opinion. O’Connor gets a similar 34% favorable and 23% unfavorable rating, with 42% having no opinion. Both candidates are seen similarly as being either in touch (37% for Balderson and 35% for O’Connor) or out of touch (27% for Balderson and 27% for O’Connor) with district residents.
Former incumbent Pat Tiberi won the OH-12 seat by between 27 and 40 points in his last three re-election bids. The margins have been tighter for GOP presidential candidates, with both Trump in 2016 and Mitt Romney in 2012 taking the district by approximately 10 points.
The Monmouth University Poll was conducted by telephone from July 26 to July 31, 2018 with 512 voters in Ohio’s 12th Congressional District for the August 7 special election. The question results in this release have a margin of error of +/- 4.3 percentage points for the full sample, +/- 4.8 percentage points for the standard and surge voter models, and +/- 5.3 percentage points for the low turnout model. The error of the gap between the two candidates’ vote share (i.e. the margin of the “lead”) is +/- 6.1 percentage points for the full sample and from +/- 6.7 to +/- 7.5 percentage points for the likely voter models. The poll was conducted by the Monmouth University Polling Institute in West Long Branch, NJ.
QUESTIONS AND RESULTS
(* Some columns may not add to 100% due to rounding.)
1/2. If the election for U.S. House of Representatives in your district was today, would you vote for Troy Balderson the Republican, Danny O’Connor the Democrat, Joe Manchik of the Green Party, or some other candidate? [IF UNDECIDED: If you had to vote for one of the following at this moment, do you lean more toward Troy Balderson or more toward Danny O’Connor?] [NAMES WERE ROTATED]
| With leaners | July 2018 | June 2018 | ||||||
| Full voter sample | Low Turnout | Standard | Democratic | Full voter sample | Low Turnout | Standard | Democratic | |
| Troy Balderson | 44% | 49% | 46% | 45% | 43% | 50% | 48% | 46% |
| Danny O’Connor | 43% | 44% | 45% | 46% | 33% | 35% | 39% | 39% |
| Joe Manchik | 2% | 2% | 2% | 2% | 1% |
<1% |
<1% |
<1% |
| Other | 0% | 0% | 0% | 0% | 2% | 2% | 1% | 1% |
| (VOL) Undecided | 11% | 5% | 7% | 7% | 21% | 13% | 12% | 13% |
| (n) | (512) | (344) | (423) | (423) | (501) | (263) | (371) | (371) |
[QUESTIONS 3 & 4 WERE ROTATED]
3. Is your general impression of Troy Balderson favorable or unfavorable, or do you have no opinion of him?
| TREND: | July 2018 | June 2018 |
| Favorable | 33% | 31% |
| Unfavorable | 26% | 13% |
| No opinion | 42% | 55% |
| (n) | (512) | (501) |
4. Is your general impression of Danny O’Connor favorable or very unfavorable, or do you have no opinion of him?
| TREND: | July 2018 | June 2018 |
| Favorable | 34% | 27% |
| Unfavorable | 23% | 11% |
| No opinion | 42% | 62% |
| (n) | (512) | (501) |
5. How much interest do you have in the upcoming special election for House of Representatives – a lot of interest, a little interest, or not much interest at all?
| TREND: | July 2018 | June 2018 |
| A lot | 56% | 38% |
| A little | 30% | 37% |
| Not much at all | 14% | 24% |
| (VOL) Don’t know | 0% | 0% |
| (n) | (512) | (501) |
6. Have you been following the campaign in your Congressional district very closely, somewhat closely, or not too closely?
| TREND: | July 2018 | June 2018 |
| Very closely | 24% | 6% |
| Somewhat closely | 42% | 35% |
| Not too closely | 34% | 59% |
| (VOL) Don’t know | 0% | 0% |
| (n) | (512) | (501) |
7. Do you approve or disapprove of the job Donald Trump is doing as president? [Do you (approve/disapprove) strongly or somewhat?]
| TREND: | July 2018 | June 2018 |
| Strongly approve | 33% | 34% |
| Somewhat approve | 13% | 14% |
| Somewhat disapprove | 9% | 9% |
| Strongly disapprove | 40% | 38% |
| (VOL) Don’t know | 5% | 5% |
| (n) | (512) | (501) |
8. On most issues would you say you support or oppose what President Trump is doing?
| TREND: | July 2018 | June 2018 |
| Support | 45% | 48% |
| Oppose | 46% | 41% |
| (VOL) Depends/both | 7% | 7% |
| (VOL) Don’t know | 2% | 4% |
| (n) | (512) | (501) |
9. How important is it for you to cast a vote for Congress that shows your [support of/opposition to] President Trump – very important, somewhat important, not too important, or not at all important?
| TREND: | July 2018 | June 2018 |
| Very important | 62% | 53% |
| Somewhat important | 17% | 23% |
| Not too important | 5% | 5% |
| Not at all important | 5% | 5% |
| (VOL) Don’t know | 11% | 13% |
| (n) | (512) | (501) |
10. Would you rather see the Republicans or the Democrats in control of Congress, or doesn’t this matter to you?
| TREND: | July 2018 | June 2018 |
| Republicans | 41% | 43% |
| Democrats | 36% | 34% |
| Does not matter | 21% | 19% |
| (VOL) Don’t know | 2% | 4% |
| (n) | (512) | (501) |
[QUESTIONS 11 & 12 WERE ROTATED]
11. Do you think Troy Balderson is in touch or out of touch with the residents of this district?
| TREND: | July 2018 | June 2018 |
| In touch | 37% | 27% |
| Out of touch | 27% | 21% |
| (VOL) Don’t know | 36% | 52% |
| (n) | (512) | (501) |
12. Do you think Danny O’Connor is in touch or out of touch with the residents of this district?
| TREND: | July 2018 | June 2018 |
| In touch | 35% | 25% |
| Out of touch | 27% | 19% |
| (VOL) Don’t know | 37% | 56% |
| (n) | (512) | (501) |
[QUESTIONS 13 & 14 WERE ROTATED]
13. If Troy Balderson is elected do you think he will be too supportive of Donald Trump, not supportive enough, or will he offer the right amount of support to Trump?
| July 2018 | |
| Too supportive | 36% |
| Not supportive enough | 5% |
| Right amount of support | 37% |
| (VOL) Don’t know | 23% |
| (n) | (512) |
14. If Danny O’Connor is elected do you think he will be too supportive of Nancy Pelosi, not supportive enough, or will he offer the right amount of support to Pelosi?
| July 2018 | |
| Too supportive | 30% |
| Not supportive enough | 7% |
| Right amount of support | 36% |
| (VOL) Don’t know | 28% |
| (n) | (512) |
15. Do you approve or disapprove of the tax reform plan passed by Congress in December? [Do you (approve/disapprove) strongly or somewhat?]
| July 2018 | |
| Strongly approve | 27% |
| Somewhat approve | 20% |
| Somewhat disapprove | 11% |
| Strongly disapprove | 24% |
| (VOL) Don’t know | 17% |
| (n) | (512) |
16. Under this new tax plan, do you think the federal taxes you pay will go up, go down, or stay about the same?
| July 2018 | |
| Go up | 24% |
| Go down | 23% |
| Stay about the same | 41% |
| (VOL) Don’t know | 12% |
| (n) | (512) |
17. Do you think President Trump’s trade and tariff policies will help, hurt, or have no impact on the economy in this part of Ohio?
| July 2018 | |
| Help | 34% |
| Hurt | 46% |
| Have no impact | 9% |
| (VOL) Don’t know | 11% |
| (n) | (512) |
18. How important is it for you personally to get involved in politics – very important, somewhat important, not too important, or not at all important?
| July 2018 | |
| Very important | 38% |
| Somewhat important | 40% |
| Not too important | 13% |
| Not at all important | 8% |
| (VOL) Don’t know | 1% |
| (n) | (512) |
METHODOLOGY
The Monmouth University Poll was sponsored and conducted by the Monmouth University Polling Institute from July 26 to July 31, 2018 with a random sample of 512 potential voters in Ohio’s 12th Congressional District, drawn from a list of registered voters who voted in at least one of the last four general elections or have registered to vote since January 2016. This includes 306 contacted by a live interviewer on a landline telephone and 206 contacted by a live interviewer on a cell phone. Monmouth is responsible for all aspects of the survey design, data weighting and analysis. Final sample is weighted for region, party registration, age, gender, education and race based on state voter registration list and U.S. Census information. Data collection support provided by Braun Research (field) and L2 (voter sample). For results based on this sample, one can say with 95% confidence that the error attributable to sampling has a maximum margin of plus or minus 4.3 percentage points (unadjusted for sample design). Sampling error can be larger for sub-groups (see table below). In addition to sampling error, one should bear in mind that question wording and practical difficulties in conducting surveys can introduce error or bias into the findings of opinion polls.
| DEMOGRAPHICS (weighted) |
|
Party Registration |
| 47% Republican |
| 26% Democrat |
| 27% Neither |
|
Self-Reported Party ID |
| 39% Republican |
| 38% Independent |
| 23% Democrat |
| 49% Male |
| 51% Female |
| 19% 18-34 |
| 24% 35-49 |
| 30% 50-64 |
| 27% 65+ |
| 89% White, non-Hispanic |
| 11% Other |
| 58% No college degree |
| 42% 4-year college degree |
| 27% Delaware County |
| 32% Franklin County |
| 22% Licking County |
| 19% Other counties |
Click on pdf file link below for full methodology and results by key demographic groups.