West Long Branch, NJ – Hillary Clinton holds a 7 point lead over Donald Trump among voters likely to cast ballots in November, which is down from a double digit lead earlier this month. The latest Monmouth University Poll also found that the number of voters who do not have a positive opinion of either major party nominee is considerably higher than any other election in recent memory.
Currently, 46% of likely voters support Clinton and 39% back Trump, with 7% supporting Libertarian Gary Johnson, and 2% backing Jill Stein of the Green Party. Support among all registered voters stands at 43% Clinton, 36% Trump, 8% Johnson, and 2% Stein. In a poll taken earlier this month shortly after the Democratic convention, Clinton held a larger 50% to 37% lead among likely voters and a 46% to 34% lead among all registered voters.
Clinton has the support of 85% of Democrats, a slight drop from the 92% support she had a few weeks ago. Trump gets the backing of 78% of Republicans, which is virtually unchanged from 79% earlier this month. Independents remain divided, although they now give slightly more support to Clinton (37%) than to Trump (32%). In prior Monmouth polls, Trump had the nominal advantage among independents, including a slim 32% to 30% edge in early August.
“The margin has narrowed since her post-convention bounce, but Clinton is holding onto an underlying advantage over Trump among key voting blocs,” said Patrick Murray, director of the independent Monmouth University Polling Institute.
Clinton has faced more controversy recently as critics point to emails that suggest staff at the Department of State arranged meetings specifically for Clinton Foundation donors when she was Secretary of State. Most voters (54%) are inclined to agree that donors to the Clinton family’s non-profit foundation were given special treatment. Only 26% feel she did nothing out of the ordinary. Another 20% have no opinion.
At the same time, Trump has faced renewed calls for the release of his personal tax returns, which has been a common practice of presidential candidates for more than 30 years. Nearly one-third of voters (31%) say it is very important to them that presidential candidates release their tax returns, 31% say it is somewhat important, and 36% say it is not important. Most Clinton supporters (54%) say this disclosure is very important to them while only 10% of Trump supporters feel the same.
Nearly 3-in-4 voters (73%) are aware that Trump has not released his tax returns, while 6% think he has actually done this already. By comparison, 56% are aware that Clinton has released her tax returns, while 15% believe she has not.
Trump has said that he cannot release his returns because they are under a routine IRS audit. Only 24% of voters believe this is the reason he is keeping his returns private. Most voters (52%) believe there is something in those returns he does not want the public to know.
Historically high negative views of both major party nominees
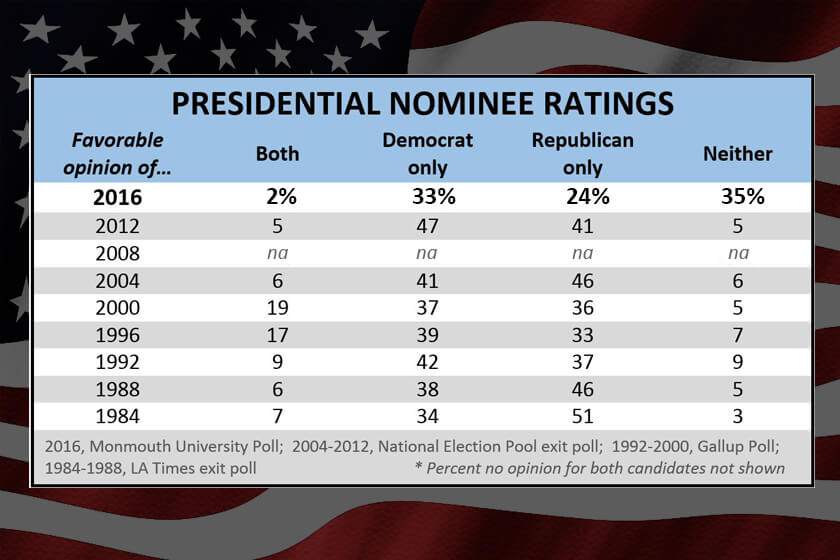
The number of voters who cannot bring themselves to voice a favorable opinion of either major party nominee is unlike anything witnessed in past elections according to new analysis from the Monmouth University Poll . Nearly no voters have a positive opinion of both Clinton and Trump while one-third do not have a favorable view of either candidate. These results are unusual.
In the current poll, 34% of voters have a favorable opinion of Clinton and 51% have an unfavorable view of her. Even fewer (26%) have a favorable opinion of Trump and 57% have an unfavorable view of him. When these results are combined, though, only 2% have a favorable opinion of both candidates, while 35% do not have a favorable opinion of either nominee.
Putting this in historical context, the number of voters in elections going back to 1984 who had a favorable opinion of both candidates was never lower than 5% – in fact registering as high as 19% in 2000. Conversely, the number of voters who did not have a favorable opinion of either nominee never rose higher than 9%, which is a fraction of what is being seen in the current election.
“The number of voters who cannot bring themselves to voice a positive opinion of either presidential nominee is more than three times higher than in any other election in recent memory. This is unprecedented,” said Murray.
Among the 1-in-3 voters who do not have a favorable opinion of either nominee, 21% say they have a decidedly unfavorable opinion of both candidates, 7% have an unfavorable view of Clinton while expressing “no opinion” of Trump, and 8% have an unfavorable view of Trump while expressing “no opinion” of Clinton. Even taking into account differences in question wording and methodology compared to past election polls, the number of voters who hold negative views of both candidates is indisputably a record high.
Those who have an unfavorable opinion of both nominees divide their vote almost evenly among Trump, Clinton and Johnson. Among those who hold a negative view of one nominee and no opinion of the other candidate, however, more than 2-in-3 say they are voting for the candidate of whom they have no personal opinion.
“This is truly extraordinary. It seems like a significant number of voters are backing a presidential candidate about whom they cannot say anything positive,” said Murray, adding, “It is highly unlikely these voters truly have a neutral opinion of their chosen candidate. They simply may have wanted to avoid contradicting themselves by expressing a negative view of a candidate who will reluctantly get their vote.”
As a point of comparison, when Monmouth asked presidential candidate favorability in October 2012 using the same question wording, only 4% expressed an unfavorable opinion of one candidate and no opinion of the other nominee. The 15% who do this in the current poll is significantly higher.
More information on the demographic composition of these “negative voters” can be found on the Monmouth University Poll director’s blog ( Historical Presidential Nominee Favorability Ratings ).
The Monmouth University Poll was conducted by telephone from August 25 to 28, 2016 with 802 registered voters in the United States. The results in this release have a margin of error of ± 3.5 percent. The poll was conducted by the Monmouth University Polling Institute in West Long Branch, NJ.
QUESTIONS AND RESULTS
(* Some columns may not add to 100% due to rounding.)
1/2. If the election for President was today, would you vote for Donald Trump the Republican, Hillary Clinton the Democrat, Gary Johnson the Libertarian, or Jill Stein of the Green Party? [IF UNDECIDED: If you had to vote for one of the following candidates at this moment, who do you lean toward – Donald Trump or Hillary Clinton?] [NAMES WERE ROTATED]
| TREND: Registered voters (with leaners) | Late Aug. 2016 | Early Aug. 2016 | July 2016 | June 2016 | March 2016 |
| Donald Trump | 36% | 34% | 40% | 36% | 34% |
| Hillary Clinton | 43% | 46% | 43% | 42% | 42% |
| Gary Johnson | 8% | 7% | 5% | 9% | 11% |
| Jill Stein | 2% | 2% | 2% | 4% | n/a |
| (VOL) Other candidate | 1% | <1% | 2% | 2% | 1% |
| (VOL) Undecided | 7% | 6% | 6% | 4% | 5% |
| (VOL) No one | 4% | 4% | 4% | 1% | 7% |
| Unwtd N | 802 | 803 | 805 | 803 | 848 |
| TREND: Likely voters (with leaners) | Late Aug. 2016 | Early Aug. 2016 | July 2016 | June 2016 | March 2016 |
| Donald Trump | 39% | 37% | 43% | 37% |
n/a |
| Hillary Clinton | 46% | 50% | 45% | 44% |
n/a |
| Gary Johnson | 7% | 7% | 5% | 9% |
n/a |
| Jill Stein | 2% | 2% | 1% | 4% |
n/a |
| (VOL) Other candidate | 1% |
<1% | 2% | 1% |
n/a |
| (VOL) Undecided | 5% | 3% | 4% | 3% |
n/a |
| (VOL) No one | 0% | 0% | 0% | 1% |
n/a |
| Unwtd N |
689 |
683 |
688 |
721 |
n/a |
HEAD TO HEAD – TRUMP v. CLINTON [Johnson/Stein/Other supporters reassigned to major party nominee they lean toward]:
| TREND: Registered voters | Late Aug. 2016 | Early Aug. 2016 | July 2016 | June 2016 | March 2016 |
| Donald Trump | 38% | 36% | 41% | 40% | 38% |
| Hillary Clinton | 47% | 50% | 44% | 47% | 48% |
| (VOL) Other candidate | 4% | 4% | 5% | 5% | 2% |
| (VOL) Undecided | 7% | 6% | 6% | 6% | 3% |
| (VOL) No one | 4% | 4% | 4% | 2% | 9% |
| Unwtd N |
802 |
803 |
805 |
803 |
848 |
| TREND: Likely voters | Late Aug. 2016 | Early Aug. 2016 | July 2016 | June 2016 | March 2016 |
| Donald Trump | 42% | 40% | 45% | 41% |
n/a |
| Hillary Clinton | 49% | 54% | 46% | 49% |
n/a |
| (VOL) Other candidate | 4% | 3% | 4% | 5% |
n/a |
| (VOL) Undecided | 5% | 3% | 4% | 5% |
n/a |
| (VOL) No one | 0% | 0% | 0% | 1% |
n/a |
| Unwtd N |
689 |
683 |
688 |
721 |
n/a |
[QUESTIONS 3 & 4 WERE ROTATED]
3. Is your general impression of Donald Trump favorable or unfavorable, or do you have no opinion of him?
| TREND: Registered voters | Late Aug. 2016 | Early Aug. 2016 | July 2016 | June 2016 | March 2016 | Oct. 2015 | Aug. 2015 | June 2015 |
| Favorable | 26% | 26% | 31% | 28% | 30% | 32% | 31% | 18% |
| Unfavorable | 57% | 61% | 53% | 57% | 60% | 50% | 54% | 57% |
| No opinion | 17% | 14% | 16% | 15% | 11% | 18% | 14% | 25% |
| Unwtd N |
802 |
803 |
805 |
803 |
848 |
836 |
1,033 |
829 |
4. Is your general impression of Hillary Clinton favorable or unfavorable, or do you have no opinion of her?
| TREND: Registered voters | Late Aug. 2016 | Early Aug. 2016 | July 2016 | June 2016 | March 2016 | Oct. 2015 | Aug. 2015 | June 2015 |
| Favorable | 34% | 37% | 34% | 36% | 40% | 41% | 38% | 41% |
| Unfavorable | 51% | 49% | 52% | 52% | 51% | 48% | 48% | 44% |
| No opinion | 15% | 14% | 14% | 13% | 9% | 11% | 14% | 14% |
| Unwtd N |
802 |
803 |
805 |
803 |
848 |
836 |
1,033 |
829 |
[QUESTIONS 5 & 6 WERE ROTATED]
5. To the best of your knowledge, has Donald Trump released his tax returns to the public, or not?
| Registered voters | Late Aug. 2016 |
| Has | 6% |
| Has not | 73% |
| (VOL) Don’t know | 22% |
| Unwtd N |
802 |
6. To the best of your knowledge, has Hillary Clinton released her tax returns to the public, or not?
| Registered voters | Late Aug. 2016 |
| Has | 56% |
| Has not | 15% |
| (VOL) Don’t know | 29% |
| Unwtd N |
802 |
7. How important is it to you that presidential candidates release their tax returns – very important, somewhat important, or not important?
| Registered voters | Late Aug. 2016 |
| Very important | 31% |
| Somewhat important | 31% |
| Not important | 36% |
| (VOL) Don’t know | 1% |
| Unwtd N |
802 |
8. As of today, Donald Trump has not released his taxes because he says they are going through a routine I.R.S. audit. Do you think he is keeping his taxes private because of the audit process or because there is something in those returns he doesn’t want the public to know?
| Registered voters | Late Aug. 2016 |
| Because of the audit | 24% |
| Something he doesn’t want the public to know | 52% |
| (VOL) Both | 3% |
| (VOL) Neither | 5% |
| (VOL) Don’t know | 16% |
| Unwtd N |
802 |
Turning to the other candidate,
9. Are you aware that the Clinton family has its own non-profit foundation, or haven’t you heard about this before?
| Registered voters | Late Aug. 2016 |
| Aware | 81% |
| Have not heard | 19% |
| Unwtd N |
802 |
10. Do you think Hillary Clinton gave special treatment to big donors of the Clinton Foundation when she was Secretary of State or did she do nothing out of the ordinary in the way she treated them?
| Registered voters | Late Aug. 2016 |
| Special treatment | 54% |
| Nothing out of the ordinary | 26% |
| (VOL) Don’t know | 20% |
| Unwtd N |
802 |
METHODOLOGY – The Monmouth University Poll was sponsored and conducted by the Monmouth University Polling Institute from August 25 to 28, 2016 with a national random sample of 802 registered voters. Interviews were conducted by a live caller in English, including 401 drawn from a list of registered voters (200 landline / 201 cell phone) and 401 using random digit dial (200 landline / 201 cell phone). Monmouth is responsible for all aspects of the survey design, data weighting and analysis. The final sample is weighted for age, gender, race and partisanship based on voter list and U.S. Census information. Data collection support provided by Braun Research (field), Aristotle (voter list sample), and SSI (RDD sample). For results based on this sample, one can say with 95% confidence that the error attributable to sampling has a maximum margin of plus or minus 3.5 percentage points (unadjusted for sample design). Sampling error can be larger for sub-groups (see table below). In addition to sampling error, one should bear in mind that question wording and practical difficulties in conducting surveys can introduce error or bias into the findings of opinion polls.
Click on pdf file link below for full methodology and results by key demographic groups.
| DEMOGRAPHICS (weighted) |
Self-Reported |
| 28% Republican |
| 40% Independent |
| 32% Democrat |
| 47% Male |
| 53% Female |
| 24% 18-34 |
| 26% 35-49 |
| 28% 50-64 |
| 22% 65+ |
| 71% White |
| 14% Black |
| 11% Hispanic |
4% Asian/Other |


